INTRODUCTION
The liver is one of the critical organs for maintaining the homeostasis and health of the whole human body by controlling overall energy metabolism and detoxification. At the same time, the incidence of hepatocellular carcinoma (HCC) is the fourth leading cause of cancer-related death (Bray et al., 2018). Normal, healthy hepatocytes play a key role in maintaining normal blood glucose levels by stimulating gluconeogenesis when diet-derived glucose supply is insufficient. They also uptake the excess glucose from the blood plasma and then transform it into triglyceride (TG) by stimulating hepatic de novo lipogenesis (DNL). However, such a metabolic balance was lost in many cancer cells by the well-known metabolic reprogramming, aerobic glycolysis known as the Warburg effect (Ward & Thompson, 2012). The ‘aerobic glycolysis’ shown in many cancer cells means that an excessive amount of glucose should be supplied to overcome the lower energy efficiency of cancer cells. Thus, the inhibition of aerobic glycolysis is one interesting metabolic target for suppressing the proliferation of cancer cells. Although several agents to block some steps of glycolysis have been tested, they have been unsuccessful because of unexpected toxicity and inefficient suppression of cancer cell proliferation (Raez et al., 2013).
Metformin, a widely prescribed hypoglycemic drug for the treatment of type II diabetes mellitus (T2DM; Rena et al., 2017), has gained interest because of its possible anti-cancer potential in several cancer cells and animals (Vancura et al., 2018). The basic action mechanism of metformin is to inhibit hepatic gluconeogenesis and increase peripheral insulin sensitivity therefore preventing hyperglycemia in T2DM patients. The anti-cancer potential of metformin has been suggested in many previous studies finding the lower incidence and mortality of various cancers including breast, colorectal, pancreatic, and prostate cancer in T2DM patients treated with metformin compared to the untreated patients (Zhang et al., 2013). In addition, metformin is also anti-inflammatory (Zhang et al., 2021), anti-aging (Barzilai et al., 2016), and modulates the gut microbiota (Forslund et al., 2015).
We previously reported that metformin induces apoptosis (Park, 2015) and a marked increase in glucose consumption and reactive oxygen species (ROS) production in H4IIE HCCs (Park, 2019). Our recent study also found that metformin treatment increases intracellular fat accumulation and also induces together with the induction of apoptosis via AMP-activated protein kinase (AMPK) activation in H4IIE HCC cells (Park et al., 2023). From these findings, we hypothesized that excessive fat accumulation might exert cytotoxic effects and that the metformin-induced lipotoxicity and following pro-apoptotic activity could be interfered with by the pharmacological inhibition of hepatic DNL by fatty acid synthase (FASN) inhibitors. Here we provide evidence that different FASN inhibitors reduce metformin-induced increase of DNL and apoptosis, further addressing the effect of hepatic DNL on the viability of H4IIE HCCs.
MATERIALS AND METHODS
Fetal bovine serum (FBS) was purchased from Life Technologies (Rockville, MD, USA). Polyclonal and monoclonal antibodies and Horseradish peroxidase (HRP)-conjugated secondary antibodies were from Cell Signaling Technology (Danvers, MA, USA) and Santa Cruz Biotechnology (Santa Cruz, CA, USA), respectively. Materials and reagents for polyacrylamide gel electrophoresis and immunoblot analysis except antibodies were obtained from Invitrogen (Carlsbad, CA, USA). Unless otherwise specified, all other reagents were purchased from Sigma-Aldrich Chemical (Sigma-Aldrich, St. Louis, MO, USA).
H4IIE cells were obtained from the Korean Cell Line Bank (Seoul, Korea) and grown in Dulbecco’s modified Eagle’s medium (DMEM) supplemented with 10% FBS. To prepare the experiments, H4IIE cells were incubated in serum-free DMEM overnight to minimize the residual cell growth effect of FBS contained in the growth medium. The cells were washed with Dulbecco’s phosphate-buffered saline (D-PBS) and further incubated in DMEM containing different test reagents.
Cell viability was analyzed using the 3-(4,5-dimethylthiazol-2-yl)-2,5-diphenyltetrazolium bromide (MTT) assay as described previously (Mosmann, 1983). After treatment with the reagents, H4IIE cells were washed twice with D-PBS and further incubated in MTT solution (0.5 mg/mL in D-PBS) for 30 min at 37°C. The MTT solution was removed, and the blue-colored formazan product was subsequently solubilized in 0.5 mL of 2-propanol for 20 min. The absorbance of the converted dye was measured at a wavelength of 570 nm.
After treatment, the glucose concentration in the medium was measured using a glucose assay reagent (Asan Pharm, Seoul, Korea) based on the glucose oxidase method. The amount of glucose in the culture medium was subtracted from that of DMEM to calculate the glucose consumption (Yin et al., 2002). The amount of cytoplasmic TG was measured using an assay kit (TG-S, Asan Pharm) with a modification. Briefly, cells in 35-mm culture dishes were collected with a rubber policeman, and the cell suspension was briefly centrifuged. After the removal of the supernatant culture medium, the cell pellet was homogenized with 0.1 mL of lysis buffer (5% Triton X-100 in D-PBS) and heated for 3 minutes at 85°C. After cooling to room temperature, the homogenate was heated and cooled twice more. After centrifugation of the homogenates, the supernatant was used for the TG assay according to the kit’s manual. At the same time, the protein concentrations were also measured by a standard BCA method to normalize the amount of TG to the same amount of protein per sample.
After treatment, the cells were lysed in ice-cold lysis buffer (RIPA, Merck, Rahway, NJ, USA) containing diluted inhibiting cocktails containing various proteases and phosphatases. Equal amounts (10–20 μg) of protein were separated using SDS-PAGE on 4%–12% polyacrylamide gels and transferred onto PVDF membranes. The membranes were incubated in blocking buffer (5% nonfat dry milk in Tris-buffered saline [TBS]-0.1% Tween-20 [TBS-T]) for 1 h at room temperature, after which the membranes were probed with different primary antibodies (at dilutions of 1:1,000–1:2,000). After a series of washes, the membranes were further incubated with the respective HRP-conjugated secondary antibodies at a dilution of 1:10,000. The signal was detected using the enhanced chemiluminescence detection system (Intron, Seongnam, Korea).
The degree of nuclear condensation (a marker of apoptosis) was observed using a cell membrane-permeable DNA-specific fluorescent dye (bisBenzimide H33342 trihydrochloride, H33342). After treatment, the cells were incubated with H33342 (1 mg/mL) for 15 min, then observed under a fluorescent microscope (IX70, Olympus, Tokyo, Japan) and imaged using a digital camera (DP-70, Olympus). The generation of ROS within cells was detected using 2′,7′-dichlorodihydrofluorescein diacetate (H2DCFDA; Halliwell & Whiteman, 2004). H4IIE cells were grown in 12-well culture plates and treated with the reagents. After treatment, H2DCFDA (10 μmol/L) was added to each well and further incubated for 30 min. The DCF fluorescence (green) was observed under a fluorescent microscope (IX70, Olympus) and imaged using a digital camera (DP-70, Olympus).
Cytoplasmic lipid droplets were stained with Oil Red O (Ramírez-Zacarías et al., 1992). After twice washing in D-PBS, cells were fixed in 10% formalin for 5 min and further stained in staining solution (0.3% Oil Red O in 60% isopropanol for 10 min). Excess stain was removed by washing in 60% isopropanol and digitally imaged. Nile red is a fluorescent dye used to stain cytoplasmic lipid droplets (Greenspan et al., 1985). After treatment, the cells were washed twice with D-PBS and then stained with 200 ng/mL Nile red in 2% acetone for 15 min. The cells were washed again with D-PBS to remove excess stain, and Nile red-stained cells were observed and imaged by a fluorescent microscope.
The cell migration assay was performed as previously described (Justus et al., 2014). The fully grown cell monolayer was scrapped by a fine micropipette tip and then further incubated in the DMEM containing 10% FBS. Photographs were taken at 0 and 48 h, and the distance between the two edges was indicated.
The population of apoptotic cells with subG1 DNA content was measured with flow cytometric analyses. The cells were plated at a density of 2.5×10⁴ (cells/cm2) and serum-starved overnight to induce G0/G1 synchronization before treatment with reagents. After treatment, the detached cells were removed and the adherent cells were obtained by trypsin-EDTA treatment. Detached cells and adherent cells were mixed and briefly centrifuged. Cell pellets were rinsed with ice-cold phosphate-buffered saline (PBS) and fixed with ice-cold 70% ethanol for 30 min. Cells were stained with a solution (50 µg/mL propidium iodide, 50 µg/mL RNase A in PBS) for 30 min at room temperature in the dark. Cell cycle analysis was carried out by a flow cytometer (Lsrfortessa, BD Bioscience, NJ, USA).
RESULTS
FASN induces DNL from acetyl-CoA and malonyl-CoA within cells. However, it is less expressed in normal tissues, whereas highly expressed and activated in many cancer cell types. Thus, it gains interest as its potential for the development of a new anti-cancer remedy. We investigated the effect of two FASN inhibitors on the basal- or metformin-induced increase of cytoplasmic TG content, which was found in our recent study (Park et al., 2023). Cerulenin is a mycotoxin that exerts anti-cancer cytotoxicity in several in vitro and in vivo studies (Fang & Shen, 2019). The cerulenin derivative C75 also induces the apoptotic death of different cancer cells (Ho et al., 2007). However, little is known about the effect of FASN inhibitors on DNL in HCCs.
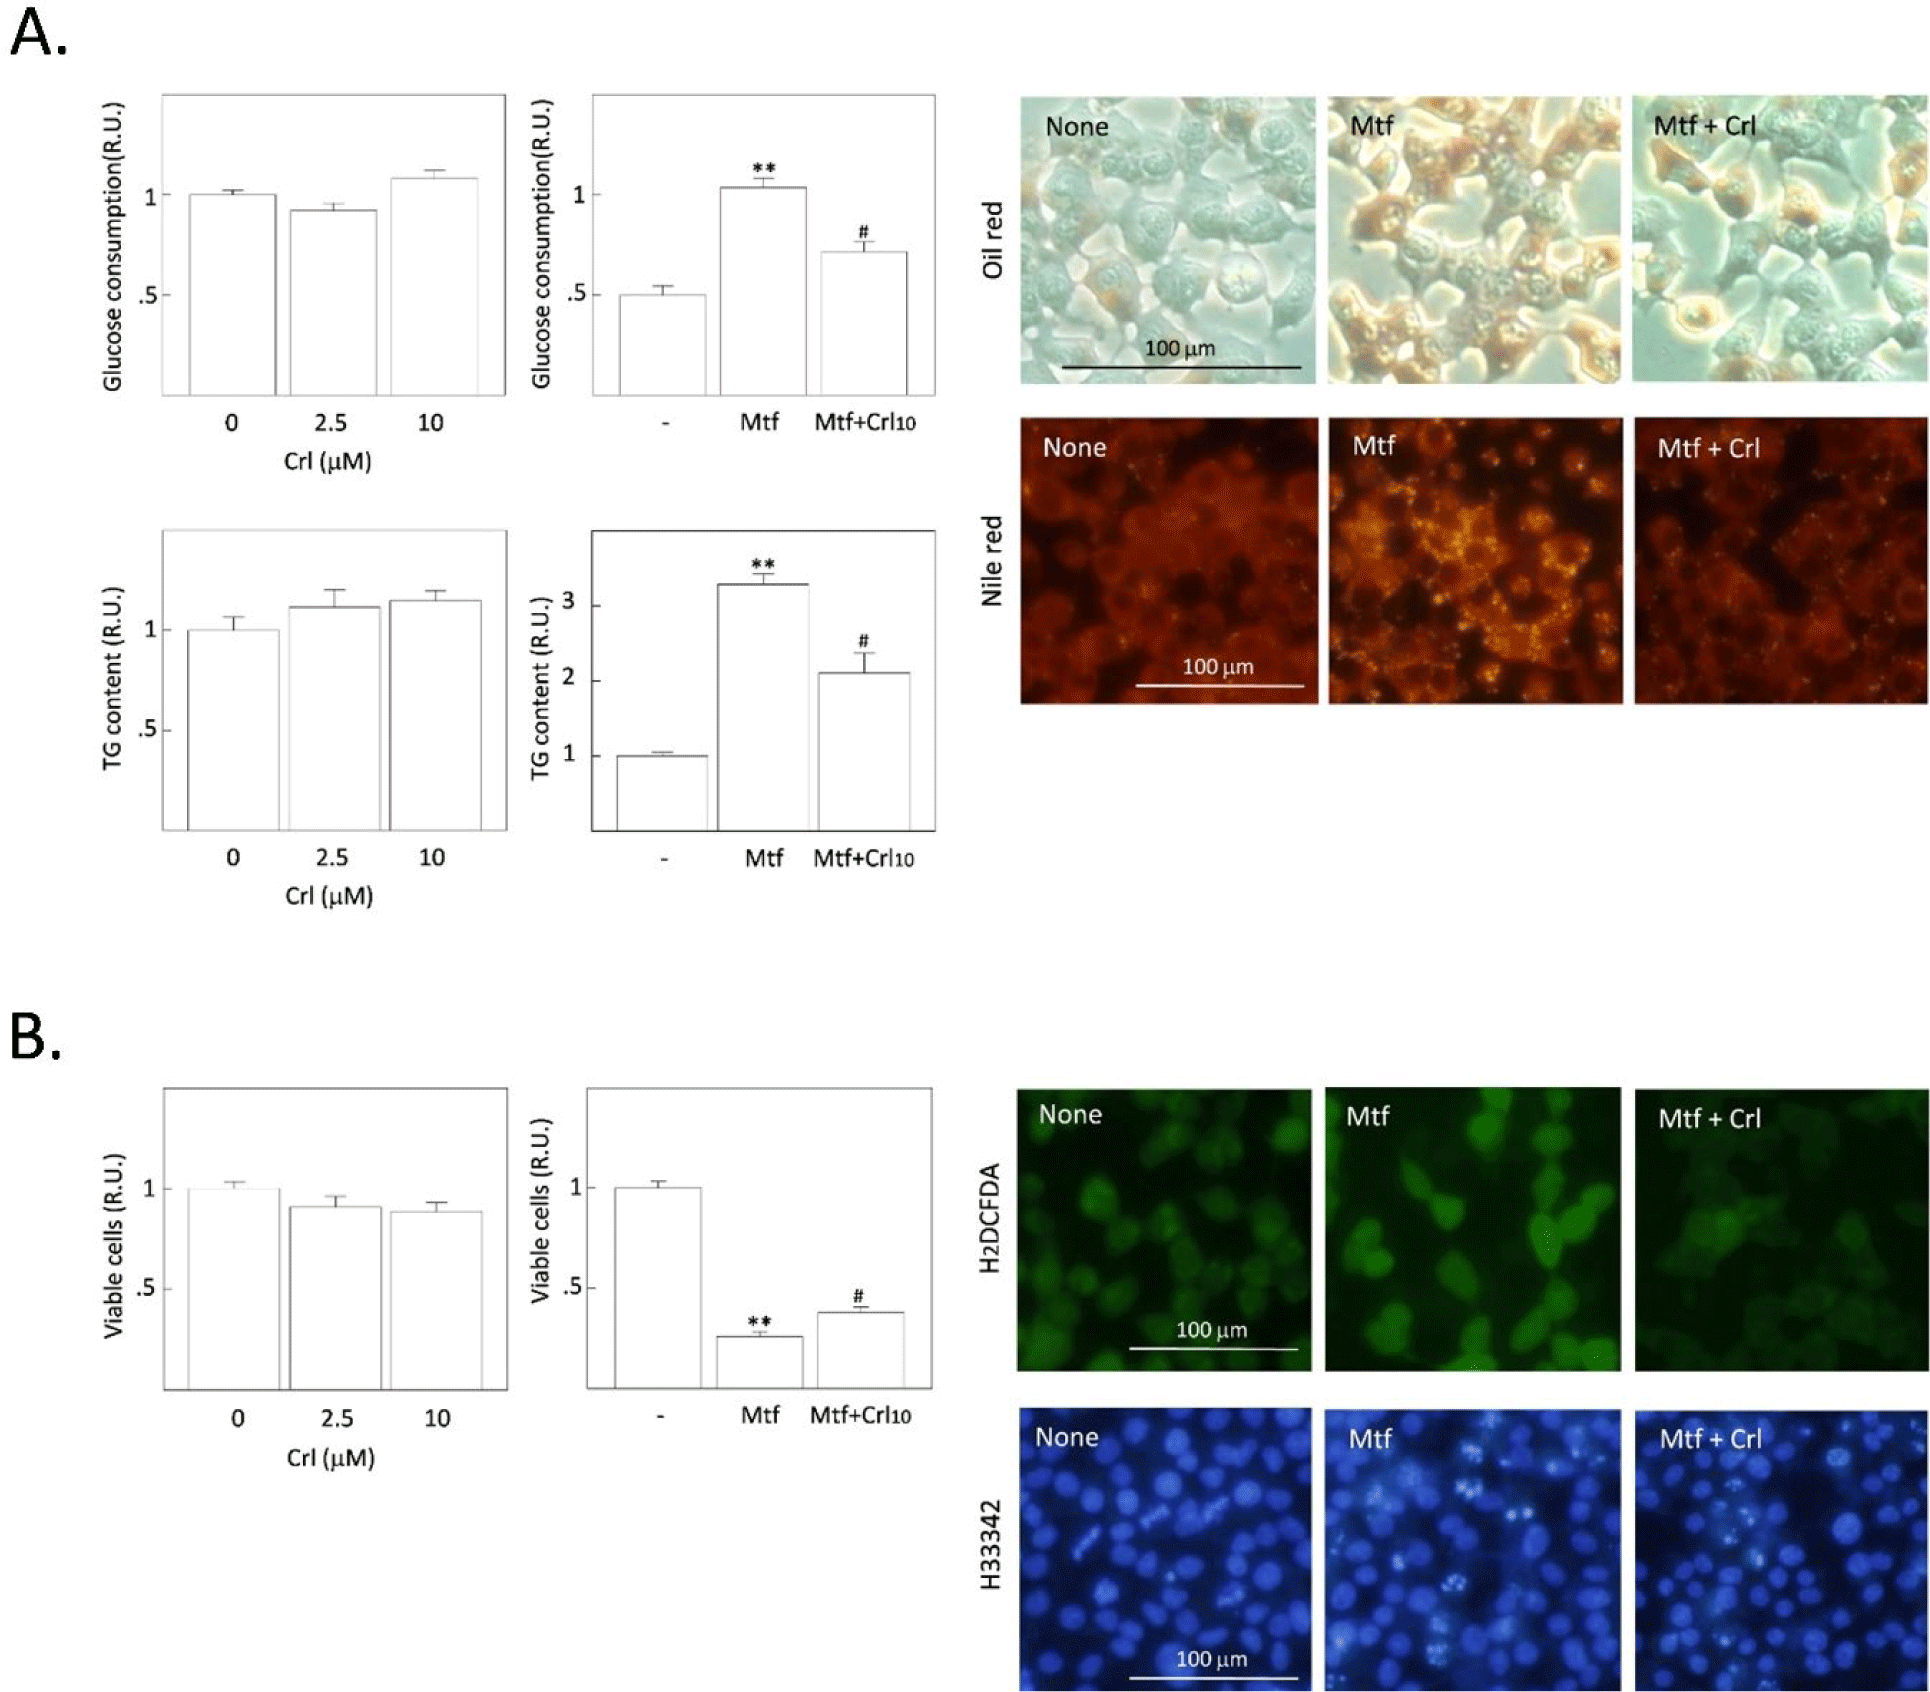
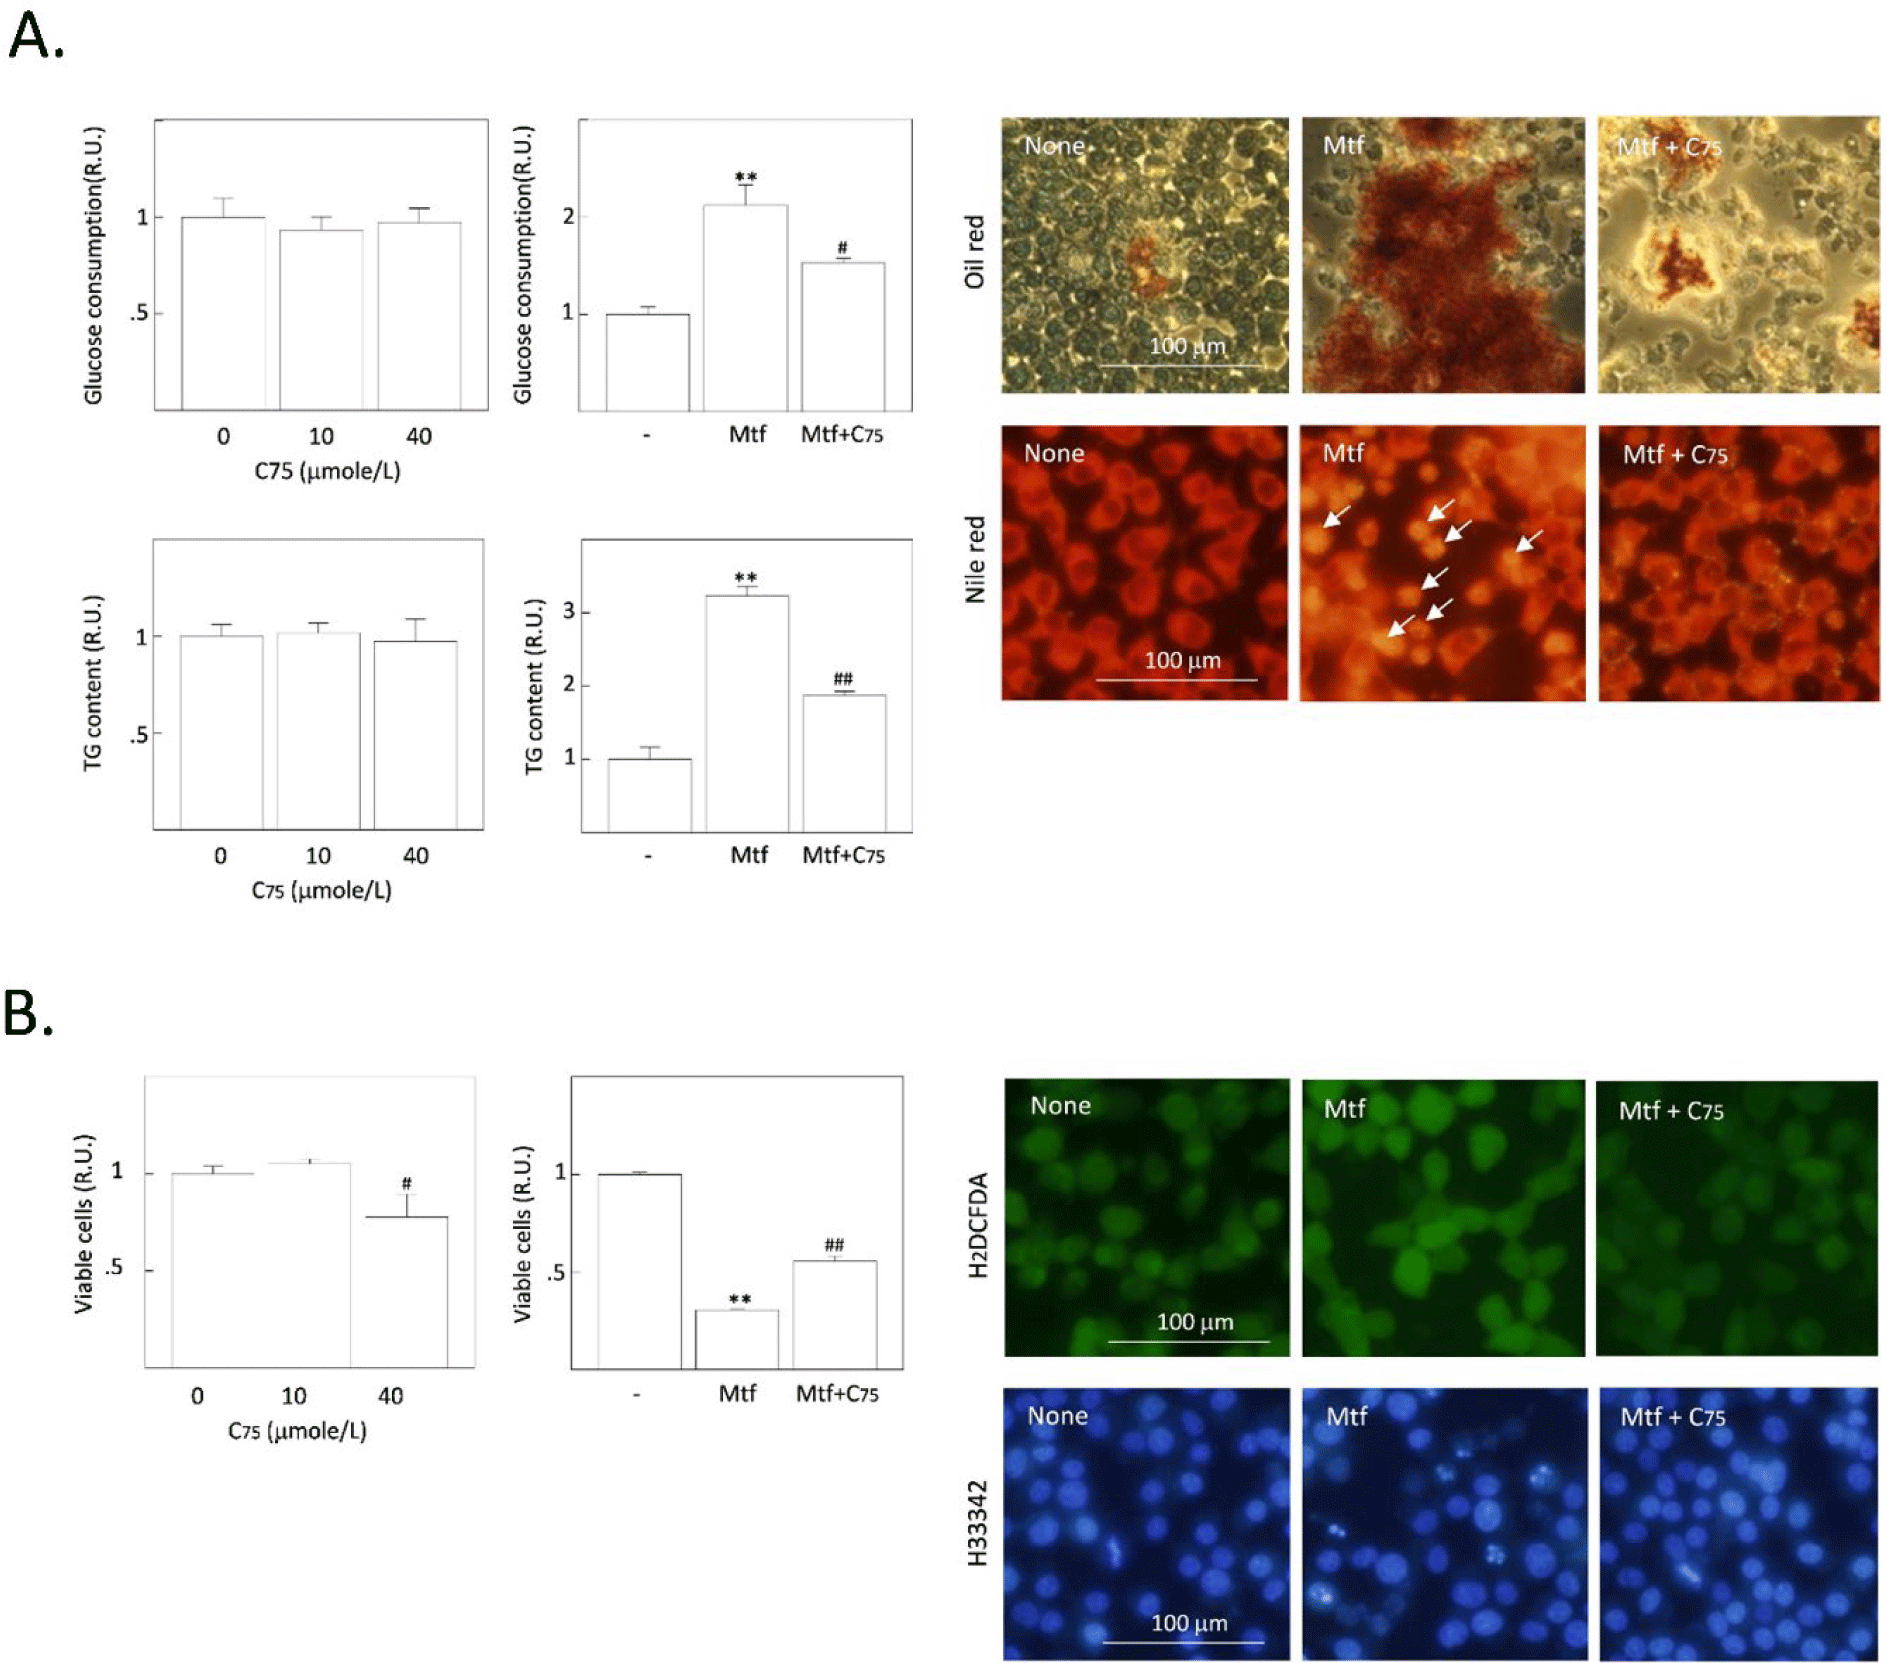
First, H4IIE rat HCCs were treated with different doses of cerulenin without metformin. The concentration of glucose remaining in the culture medium was measured after 24 h, and intracellular TG content and cell viability were measured after 48 h treatment with cerulenin. No significant changes were observed in the basal glucose consumption, TG synthesis, and cell viability by treatment with cerulenin alone (Fig. 1A). However, the metformin-induced increase in glucose consumption and TG synthesis were significantly decreased by cerulenin (10 µmol/L), and the metformin-induced decrease of cell viability was significantly increased (Fig. 1B). When intracellular fat droplets were stained with Oil Red O (chromogenic) and Nile red (fluorescent), metformin increased the intensity of oil red and Nile red within cells, indicating the stimulation of cytoplasmic TG synthesis (Fig. 1A). However, the metformin-stimulated TG synthesis was suppressed by cerulenin treatment. The number of small-fluorescent apoptotic bodies was also increased by metformin, which was decreased by cerulenin (Fig. 1B). Interestingly, the fluorescence intensity of DCF (formed by the ROS-derived hydrolysis of H2DCFDA) was increased by metformin, indicating the increase of ROS generation after metformin treatment. Cerulenin also suppressed the metformin-stimulated ROS generation (Fig. 1B). We further examined the effect of the cerulenin derivative C75 under the same experimental conditions. The effect of C75 was almost the same as that of cerulenin on the basal- and metformin-induced changes including glucose consumption, TG synthesis, and cell viability (Fig. 2A and B). Thus, it is clear that the inhibition of FASN does not affect the basal TG synthesis and cell viability, but it strongly blocks the metformin-induced TG synthesis and the induction of apoptosis. The intensity of fluorescence from Nile red staining was much more prominent within apoptotic bodies of metformin-treated cells (indicated by arrows in Fig. 2A) than healthy normal cells (representing weak or less fluorescence intensity). These results imply that the excessively accumulated fat is harmful to cell viability and the blockade of excessive fat accumulation is a survival signal in H4IIE HCC cells.


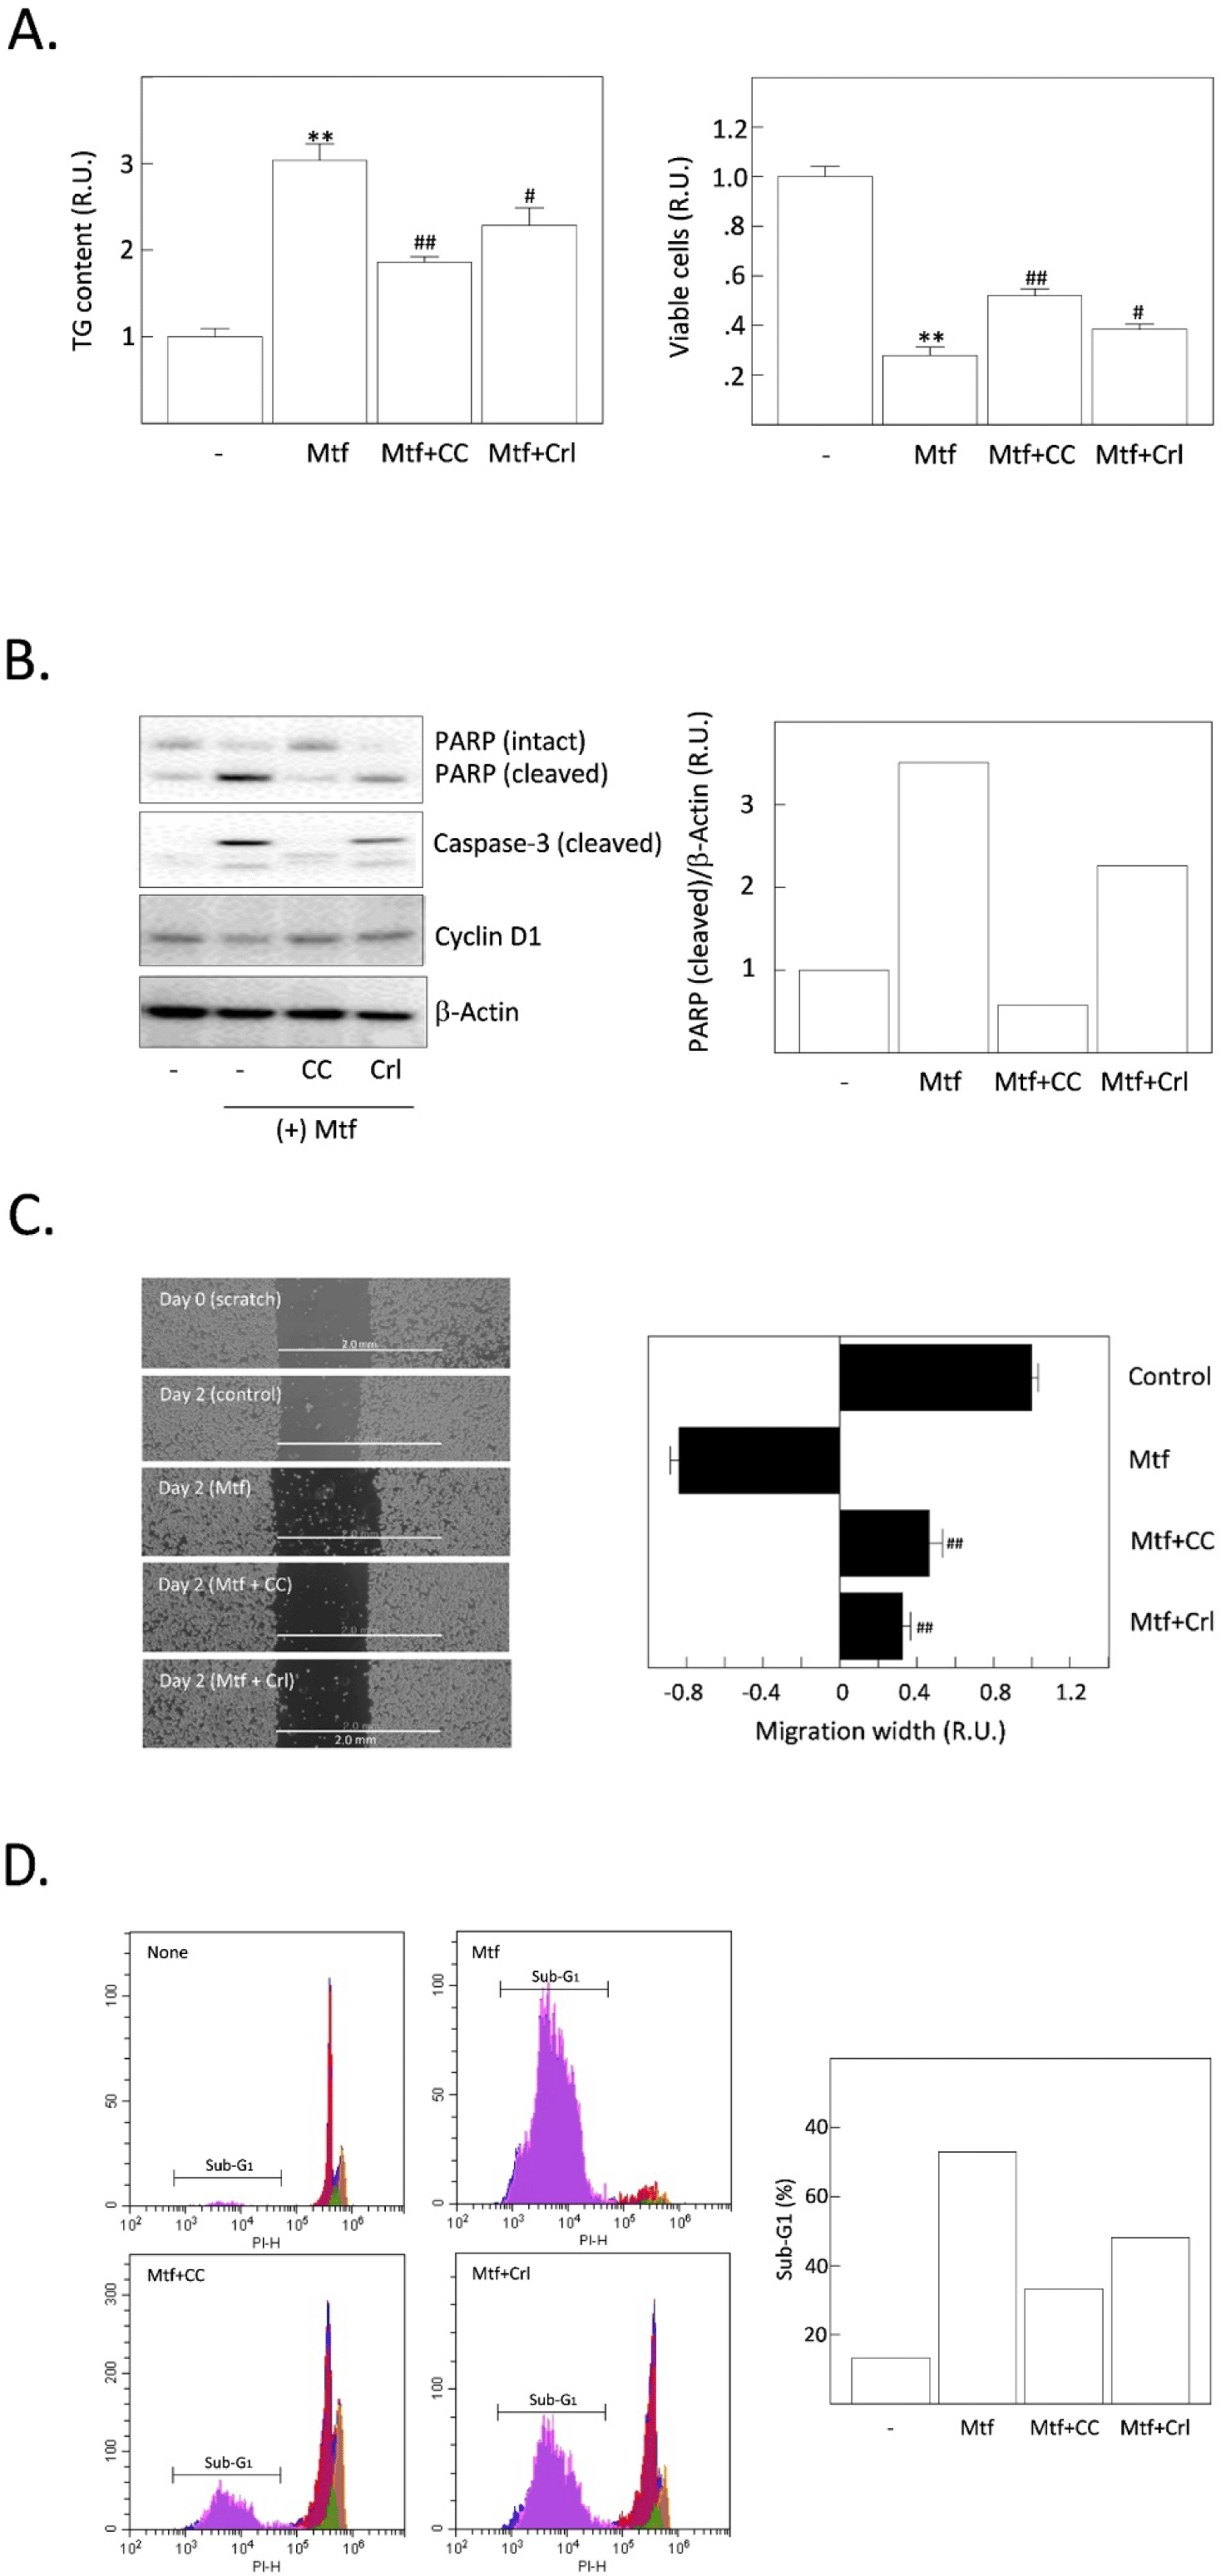
We previously reported that the inhibition of AMPK can suppress metformin-induced lipogenesis and apoptosis, suggesting that active AMPK strongly stimulates the uptake of glucose, glycolysis, the formation of acetyl-CoA, a substrate for DNL in HCC cells (Park et al., 2023). Thus, we compared the relative potential of AMPK inhibition and FASN inhibition to determine which one is the more critical player in suppressing TG synthesis and apoptotic cell death induced by metformin. Metformin-increased TG content was significantly decreased by compound C (an AMPK inhibitor) compared to cerulenin. Metformin-reduced cell viability was also significantly recovered by AMPK compared with cerulenin (Fig. 3A). Cleavage of PARP and caspase-3 precursor proteins (markers of apoptosis progression) was promoted by metformin (Fig. 3B). Compound C blocked such metformin-induced cleavage of PARP and caspase-3 but cerulenin only partially blocked. From the cell migration assay, both compound C and cerulenin recovered the metformin-suppressed migration of H4IIE cells (Fig. 3C). Finally, the relative population of cells in the sub-G1 stage was measured by flow cytometric analysis (Fig. 3D). As supporting changes, the sub-population of apoptotic (sub-G1) cells was dramatically increased by metformin and again decreased more by compound C than cerulenin.

DISCUSSION
Altered energy metabolism in cancer cells is known as the Warburg effect (Ward & Thompson, 2012). Together with the alteration of glucose metabolism, lipid metabolism is also drastically altered in transformed cells and cancer cells (Hanahan & Weinberg, 2011). Cancer cells can stimulate DNL and fatty acid oxidation to produce energy or accumulate lipids for their proliferation. Cellular lipids are necessary for plasma membrane synthesis as well as energy production. Studies have found that lipids have multiple roles within cancer cells. Oncogenic processes also induce dysregulated lipid metabolism, which then affects membrane composition (Bi et al., 2019). The increase in membrane lipid saturation can induce endoplasmic reticulum (ER) stress and apoptotic cell death (Ackerman & Celeste Simon, 2014). Excess polyunsaturated fatty acid in the plasma membrane leads to lipid peroxidation and ferroptosis (Yang & Stockwell, 2016). Thus, it is still controversial about the role of lipids in terms of their various or even opposite effect on the survival of cancer cells. Thus, the role of lipids might be a ‘sword with double edges’ like ROS in determining the fate of growing cancer cells or healthy normal cells.
In the liver, DNL is upregulated by insulin and glucose, which then promotes lipid storage. In HCC, DNL is also stimulated by glucose transported from extracellular environments (Paul et al., 2022). Our previous study showed that glucose uptake is dramatically stimulated by metformin and such a dysregulated glucose uptake leads to glycolysis and TG synthesis in H4IIE HCCs (Park et al., 2023). Because metformin finally massively promoted apoptotic cell death, we raised a question about the action mechanism of metformin’s pro-apoptotic activity. Metformin’s lipogenic- and pro-apoptotic activity was decreased by the inhibition of AMPK. If the excess stimulation of TG synthesis is the main cause of metformin’s pro-apoptotic activity, the pharmacological inhibition of FASN can completely block the pro-apoptotic activity of metformin.
Two related FASN inhibitors, cerulenin, and its derivative C75, significantly suppress the dysregulated increase of glucose uptake, TG synthesis, and apoptotic death of H4IIE HCCs. However, the suppressing potency of FASN inhibitors was significantly lower than the inhibition of AMPK. In addition, high doses (higher than 20 µmol/L) of the two FASN inhibitors induced cell death per se. in the basal condition without metformin (results not shown). ROS generation was also decreased by metformin and sensitive to FASN inhibitors. From these results, we suggest that the basal glucose uptake and TG synthesis are not up-regulated in H4IIE HCCs used in our study although other studies have reported that FASN inhibitors can induce apoptotic death of several cancer cells (Fang & Shen, 2019; Rae et al., 2020). However, most studies used higher doses of cerulenin (20 µmol/L, in liver cancer stem cells; Chen et al., 2024) and C75 (50 µmol/L, in prostate cancer stem cells; Rae et al., 2020).
From the Warburg effect, glycolysis metabolizing glucose is the main source of ATP (Ward & Thompson, 2012). So far, there are three proposed effects for energy metabolism in cancer cells (Lee et al., 2022). First, cancer cells produce ATP mainly by glycolysis under aerobic conditions (‘aerobic glycolysis’ known as the Warburg effect). Second, cancer cells induce the Warburg effect in neighboring stromal fibroblasts (cancer-associated fibroblasts, CAFs). Lactate and pyruvate secreted from CAFs are transported into cancer cells and used for ATP production through mitochondrial oxidative phosphorylation (‘reverse’ Warburg effect). Third, two different types of cancer cells help each other to survive. Glycolytic cancer cells consume glucose to produce lactate and other types of ‘oxygenated’ cancer cells consume the lactate to produce ATP. However, ATP levels are not reduced even in glucose-free conditions and the blockade of fatty acid oxidation decreases ATP production by 40% in cancer cells with no effect on normal cells (Lee et al., 2020). Thus, glucose is not a unique energy source in cancer cells. In addition to glucose, glutamine is an alternative source of ATP in cancer cells (Moreadith & Lehninger, 1984; Piva & Mcevoy-Bowe, 1998). Thus, no definitive conclusion is available to understand the exact energy metabolism of divergent cancer cells.
We hypothesized that metformin induces dysregulated, excess glucose consumption and cytoplasmic fat accumulation in H4IIE HCC cells. Such a metabolic alteration might produce any cytotoxic- or pro-apoptotic insults containing ROS-derived oxidative stresses. In normal hepatocytes, high concentrations of glucose and lipids can lead to hepatocellular injury (glucotoxicity and lipotoxicity, respectively; Mota et al., 2016). The hepatocellular injury comes from ER stress, oxidative stress, and mitochondrial damage (Liu & Green, 2019). However, pieces of evidence of glucotoxicity and lipotoxicity in HCC cells are not enough. Palmitic acid augments glucotoxicity, oxidative stress, apoptosis, and mitochondrial dysfunction in HepG2 HCC cells (Alnahdi et al., 2019). Liver X receptor alpha (LXRα)-induced lipogenesis is also lethal in HCC owing to the toxic accumulation of saturated fatty acids (Rudalska et al., 2021). Another study also showed that excess glucose alone induces cell damage due to oxidative stress and ER stress in Huh7 HCC cells (Hayashi et al., 2024). However, the pharmacological inhibition of sodium glucose transporter 2 (Kaji et al., 2018) or the impairment of aerobic glycolysis (Fiume et al., 2010) hinders the growth of HCC cells. From these findings, both the depletion of glucose and the excessive supply of glucose might be harmful to the normal growth of HCC cells.
In summary, the present study showed that the metformin-induced pro-apoptotic injury was accomplished by dysregulated glucose uptake and the subsequent TG synthesis because the inhibition of FASN suppressed the metformin-induced apoptosis of HCC cells. However, the effect of FASN inhibition was relatively weaker than that of AMPK inhibition. Different from normal cells, AMPK inhibition exerts various anti-apoptotic activities in HCC cells. Further studies are necessary to elucidate the exact pro-apoptotic action mechanisms of metformin in terms of metabolic alteration-derived cytotoxic injury in HCC cells.

