INTRODUCTION
Gonadotropins are glycoprotein hormones that are essential for the regulation of reproductive function and mainly consist of luteinizing hormone (LH) and follicle-stimulating hormone (FSH) (Anderson et al., 2018). In clinical applications such as in vitro fertilization and embryo transfer (IVF-ET), FSH and human chorionic gonadotropin (hCG) are widely used as fertility treatments for women with ovulation disorders (Lunenfeld et al., 2019). FSH increases the probability of successful fertilization by promoting the development of multiple follicles and facilitating collection of a greater number of mature oocytes (Anderson et al., 2018). hCG mimics the effects of LH by stimulating corpus luteum formation and inducing ovulation at scheduled times (Anderson et al., 2018). Although the role of gonadotropins is well established, recent studies have demonstrated their potential effects on immune function, suggesting that these hormones may play a broader physiological role than reproduction (Zakharova et al., 2020).
The thymus is a critical organ of the immune system that plays an important role in the development and maturation of T lymphocytes (T cells). Thymic stromal cells, including dendritic cells (DCs), thymic epithelial cells (TECs), endothelial cells (ECs), fibroblasts, macrophages, and connective tissue cells, provide the structural and functional framework necessary for T cell differentiation and education (Duah et al., 2021). Structurally, the thymus consists of two lobes surrounded by connective tissue, and is subdivided into the cortex and medulla. Early stage thymocytes mature in the outer cortex, whereas later-stage thymocytes develop in the inner medulla (Shichkin & Antica, 2022). The cortex is primarily responsible for positive selection, which selects T cells capable of recognizing major histocompatibility complex molecules. In contrast, the medulla facilitates negative selection, which eliminates self-reactive T cells, thereby preventing autoimmune responses (Takahama et al, 2017). Together, these processes ensure the development of a functional and self-tolerant T cell repertoire.
Degeneration of the thymus gland is closely associated with a decrease in T cell production, leading to weakened immune defenses, diminished immune responses, and an increased risk of autoimmune disease (Waksman, 1964). Immune function declines naturally with age and often contributes to the development of chronic inflammatory diseases. Age-related thymic degeneration reduces the ability of hematopoietic stem cells in the bone marrow to differentiate into T-lymphoid progenitors (Akunuru & Geiger, 2016). Within the stromal environment of a degenerated thymus, the self-renewal capacity of TECs is dramatically reduced, while fibroblasts and adipocytes proliferate, further disrupting the microenvironment required for effective T cell maturation (Moehrle & Geiger, 2016). Thymic degeneration adversely affects the function of T cell receptors (TCRs), compromising the overall immunity (Hogan et al., 2019).
Major steroid hormones, including testosterone, progesterone, and estrogen, play important roles in thymic degeneration and immune cell function. These hormones exert direct effects on TEC and other immune cells, leading to alterations in T cell development and immune regulation. For example, testosterone promotes thymic atrophy, whereas estrogen and progesterone contribute to immune cell abnormalities by modulating cytokine production and immune cell differentiation. Together, the combined effects of these hormones accelerate thymic atrophy and disrupt the ability of the immune system to maintain homeostasis (Taves & Manley, 2022). Gonadotropin-releasing hormone (GnRH) has been implicated in the development and differentiation of T cells within the thymus, thereby affecting their functional activity (Melnikova et al., 2019). Although gonadotropins are primarily known for their role in the reproductive system, increasing evidence suggests that they also affect the immune system, potentially influencing the maturation and function of immune cells in the thymus, but their specific effects on the thymus remain unclear (Combarnous, 1992; Melnikova et al., 2019).
In this study, we hypothesized that gonadotropin administration promotes the synthesis of high levels of estradiol and progesterone via ovarian stimulation, rather than exerting direct effects on immune organs. These hormones may subsequently modulate T cell development in a manner analogous to testosterone. Therefore, we investigated whether repeated administration of pregnant mare serum gonadotropin (PMSG) and hCG would induce changes in thymic morphology and gene expression consistent with thymic regression.
MATERIALS AND METHODS
6-week-old female institute of cancer research (ICR) mice were purchased from LaonBio (Seoul, Korea). The mice were housed in cages and acclimated for one week prior to the start of the experiment. The cage temperature was maintained at 22±2°C under a 12-hour light/dark cycle (lights on/off: 18 h/6 h). Throughout the experiment, the mice were provided standard rodent chow and tap water ad libitum. The mice were divided into two groups: a control group (n=6) that received six administrations of phosphate-buffered saline (PBS) and an experimental group (n=7) that received six administrations of PMSG and hCG. At the end of repeated administrations, the mice were sacrificed under CO2-induced anesthesia, and the uterus and thymus were collected. The tissues were either stored at −70°C for RNA extraction or fixed to prepare paraffin blocks for histological analysis. All animal care and experimental procedures were approved by the Institutional Animal Care and Use Committee of Seoul Women’s University and complied with the guidelines established by the Korean Ministry of Food and Drug Safety.
Thymus tissues from the mice were fixed in 4% paraformaldehyde and subsequently rinsed sequentially in ethanol. The tissues were then embedded in paraffin and sectioned into 10 μm slices. The sections were deparaffinized and rehydrated by sequential treatment with xylene and ethanol, followed by rinsing with PBS. The slides were stained with hematoxylin to visualize the nuclei and eosin to stain the cytoplasm. The stained thymus sections were examined under a light microscope (YS100; Nikon, Melville, NY, USA).
Tissue samples were stored at −70°C until RNA extraction. RNA was extracted using TRIzol reagent (15596018; Ambion, Foster City, CA, USA) to separate the proteins and nucleic acids. RNA was precipitated using chloroform (C2432, Sigma-Aldrich, Darmstadt, Germany) and isopropyl alcohol (I9516; Sigma-Aldrich). The recovered RNA was purified by washing with 75% ethanol, followed by air drying. The dried pellet was dissolved in RNase-free diethylpyrocarbonate (DEPC)-treated solution (10977-015, Invitrogen, Waltham, MA, USA) and homogenized under cold conditions. The concentration and purity of the extracted RNA were assessed using a NanoDrop spectrophotometer (ThermoFisher Scientific, South San Francisco, CA, USA). First-strand cDNA synthesis was performed in RNase-free DEPC solution containing 2 μg of total RNA and 10 pmol oligo dT at 70°C for 5 min. This was followed by double-strand cDNA synthesis in 5X RT buffer (Invitrogen) with 8 mM dNTP (Bio Basic, Markham ON, Canada) and 200 unit/μL RTase (Invitrogen) at 37°C for 60 min and at 72°C for 15 min.
qRT-PCR was performed in a total reaction volume of 20 μL, consisting of 1 μL of template cDNA, 10 μL of SYBR Green master mix (DYRT1202, Dyn-12-Bio, Seongnam, Korea), 7 μL of RNase-free DEPC-treated water (10977-015, Invitrogen), and 10 pmol of each primer (Bionir, Daejeon, Korea). Primers were designed for anti-müllerian hormone (AMH), AIRE, EVA, IL-7, PPARr, PEPCK, aP2, and 18s based on mouse cDNA sequences. qRT-PCR was performed using a LightCycler® 96 Real-time PCR system (Roche Diagnostics, Mannheim, Germany). The optimal thermal cycling protocol included initial denaturation at 95°C for 5 min, followed by 45 cycles of 95°C for 10 s, 60°C for 10 s, and 72°C for 10 s.
The thymus and spleen were mechanically dissociated by passing them through 100 μm cell strainers to obtain single-cell suspensions. Red blood cells were removed using RBC lysis buffer (R7757, Sigma-Aldrich) following the manufacturer’s protocol. The cells were washed with PBS containing 5% fetal bovine serum (FBS). For the staining of surface markers, cells were incubated with anti-mouse CD16/32 (Fc blocker; Cat# 553142; BD Biosciences, San Jose, CA, USA) on ice for 15 min to prevent nonspecific binding. They were then washed with PBS containing 5% FBS and subsequently incubated with the following antibodies at 4°C for 30 min: CD8a-PE (Cat# 100708; BioLegend, San Diego, CA, USA), CD4-FITC (Cat# 100405; BioLegend), CD25-PerCP (Cat# 102029; BioLegend), and CD44-APC (Cat# 103011; BioLegend). After staining, cells were washed with PBS containing 5% FBS. Flow cytometric data were acquired using an LSRFortessa X-20 flow cytometer (BD Biosciences). The data were analyzed using FlowJo software (BD Biosciences).
RESULTS
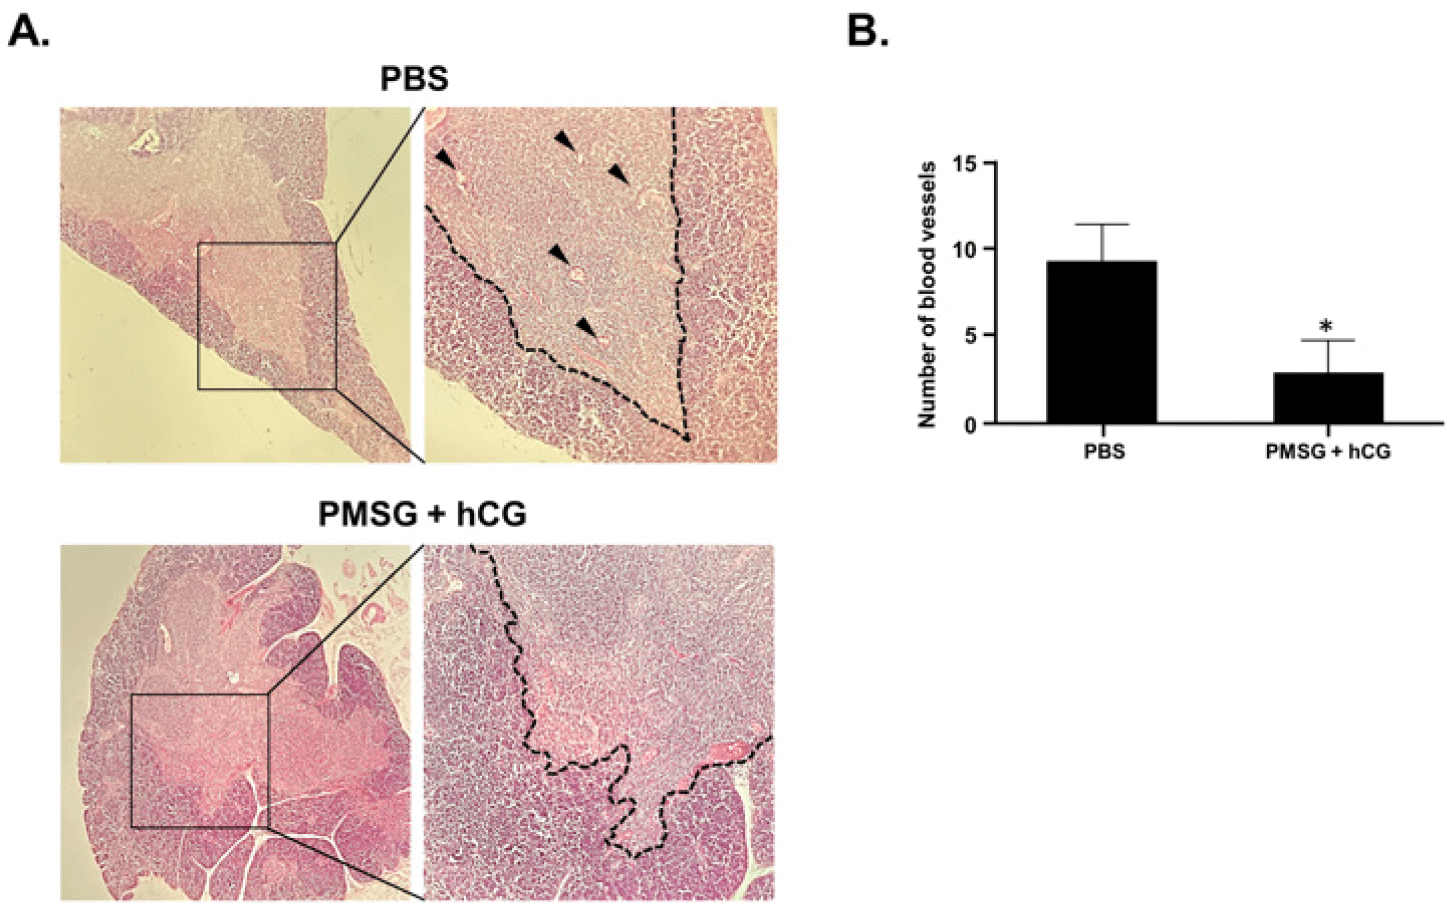
To examine the morphological differences in the thymus between the PBS-treated control group and the PMSG- and hCG-treated group, thymus sections were stained with hematoxylin and eosin (H&E) and observed under a light microscope. In the H&E-stained thymic structure, the outer, darkly stained area represented the cortex, whereas the inner, less darkly stained area represented the medulla. Compared with the thymus of the control group, the boundary between the cortex and medulla in the PMSG- and hCG-treated group appeared relatively unclear and blurred. In addition, the blood vessels distributed at the border of the cortex and medulla were more prominent in the control group than in the PMSG- and hCG-treated group (Fig. 1A). The number of blood vessels in the thymus was 8.3±3.4 in the PBS-treated control group and 3.2±2.5 in the PMSG- and hCG-treated group, showing a significant reduction following repeated administration of PMSG and hCG (Fig. 1B).

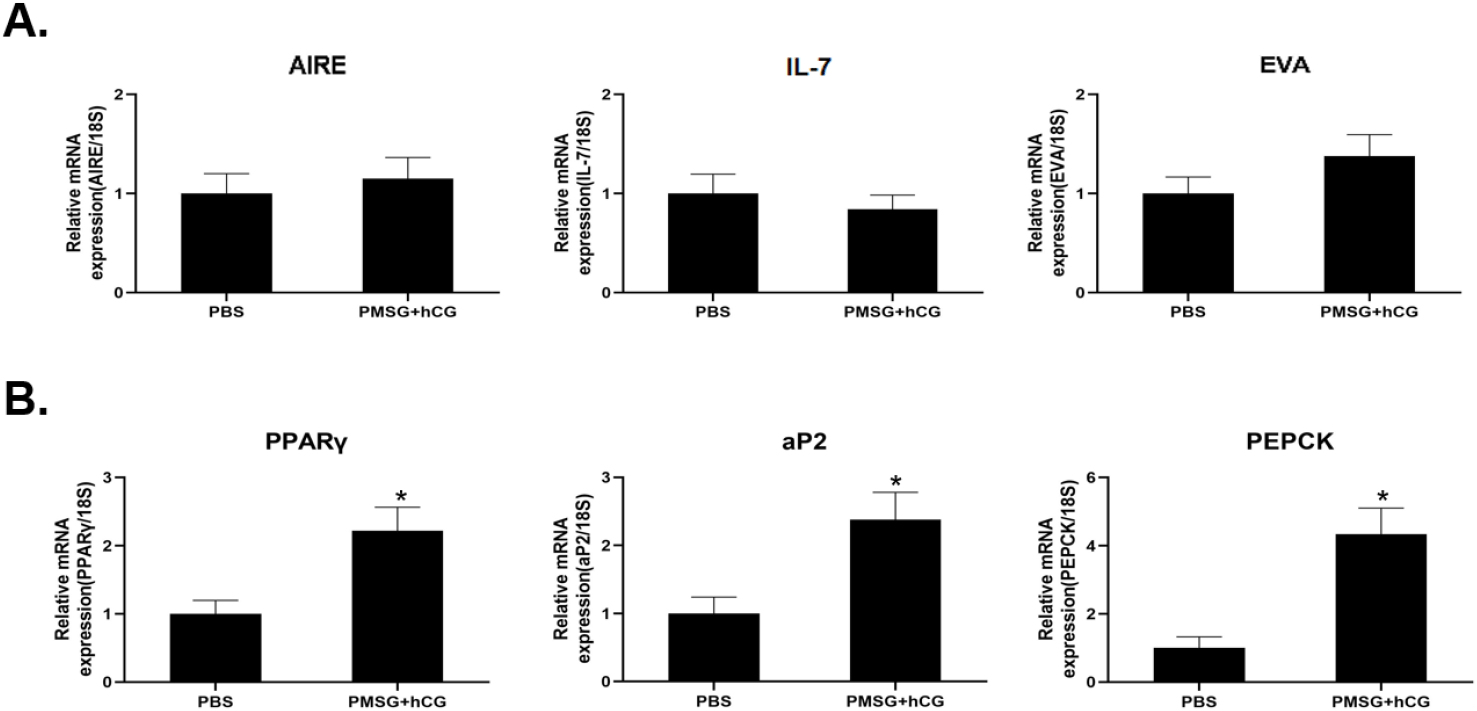
The mRNA expression levels of AIRE, EVA, and IL-7 were analyzed by qRT-PCR to evaluate the changes in TEC-related gene expression in the thymus after PMSG and hCG administration. AIRE expression showed little difference compared to that in the control group, whereas IL-7 showed a slight decrease but the difference was not statistically significant. Conversely, EVA expression increased slightly, but not significantly (Fig. 2A). In contrast, the mRNA expression of adipogenesis-related genes, including PPARγ, aP2, and PEPCK, was significantly increased in the PMSG- and hCG-treated group compared to that in the control group. Specifically, aP2 and PPARγ showed a more than 2-fold increase in expression, both of which were statistically significant. Notably, PEPCK expression significantly increased by more than 4-fold compared to that in the control group (Fig. 2B).

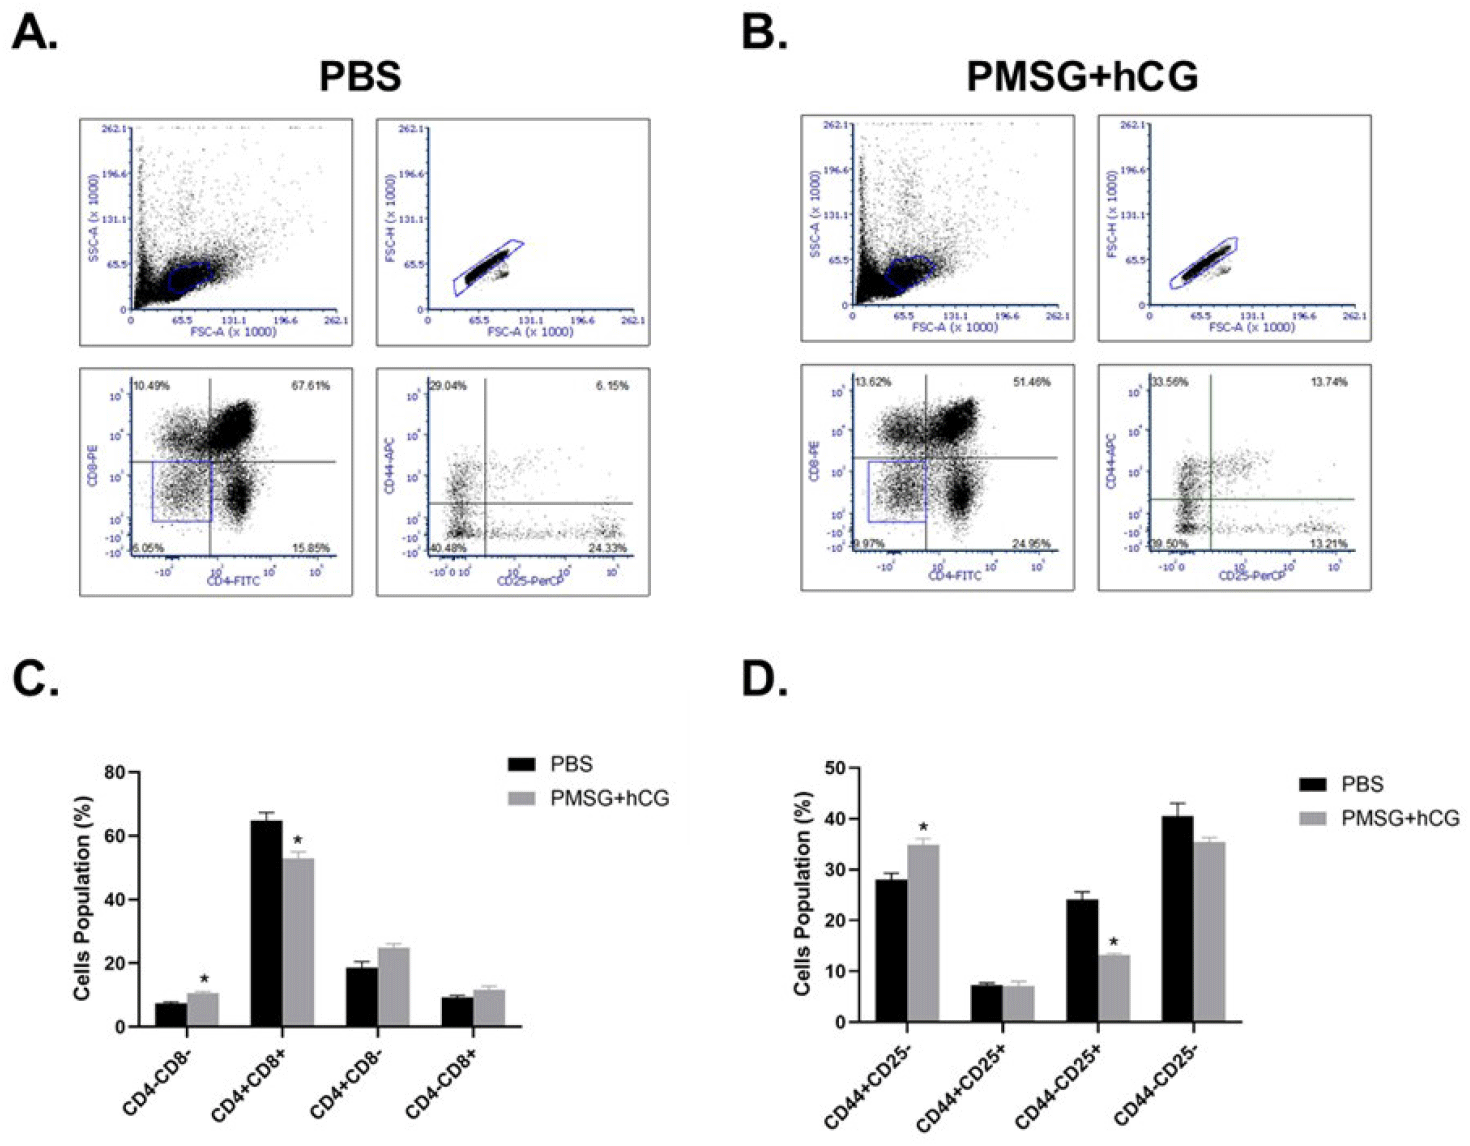
To investigate changes in T cell development in the thymus following PMSG and hCG administration, T cells were isolated from the thymus of mice treated with six administrations of PBS or PMSG and hCG, and their distribution was analyzed by flow cytometry. In the PBS-treated control group, the average proportions of CD4+CD8−, CD4+CD8+, CD4−CD8+, and CD4−CD8− T cells were 10.49±1.87%, 67.61±2.53%, 15.85±0.72%, and 6.05±0.42%, respectively. In contrast, in the PMSG- and hCG-treated group, these proportions were 13.62±1.29%, 51.46±2.11%, 24.95±1.07%, and 9.97±0.51%, respectively (Fig. 3A). These findings indicate a significant decrease in the proportion of CD4+CD8+ T cells and a significant increase in CD4− CD8− T cells in the PMSG- and hCG-treated group. Although the proportions of CD4+CD8− and CD4−CD8+ T cells were slightly higher in the PMSG- and hCG-treated group, these differences were not statistically significant (Fig. 3C). The distribution of CD44 and CD25 T cell populations was significantly altered. In the control group, the mean percentages of CD44+CD25−, CD44+CD25+, CD44−CD25+, and CD44−CD25− T cells were 28.86±1.20%, 6.10±0.44%, 23.97±1.43%, and 41.07±2.53%, respectively. In the PMSG- and hCG-treated group, these proportions were 33.19±1.17%, 13.38±0.93%, 12.72±0.29%, and 40.71±0.85%, respectively (Fig. 3B). The PMSG- and hCG-treated group showed a significant increase in the proportion of CD44+ CD25− T cells and a significant decrease in CD44+CD25+ T cells, whereas no significant changes were observed in CD44−CD25− T cells (Fig. 3D).

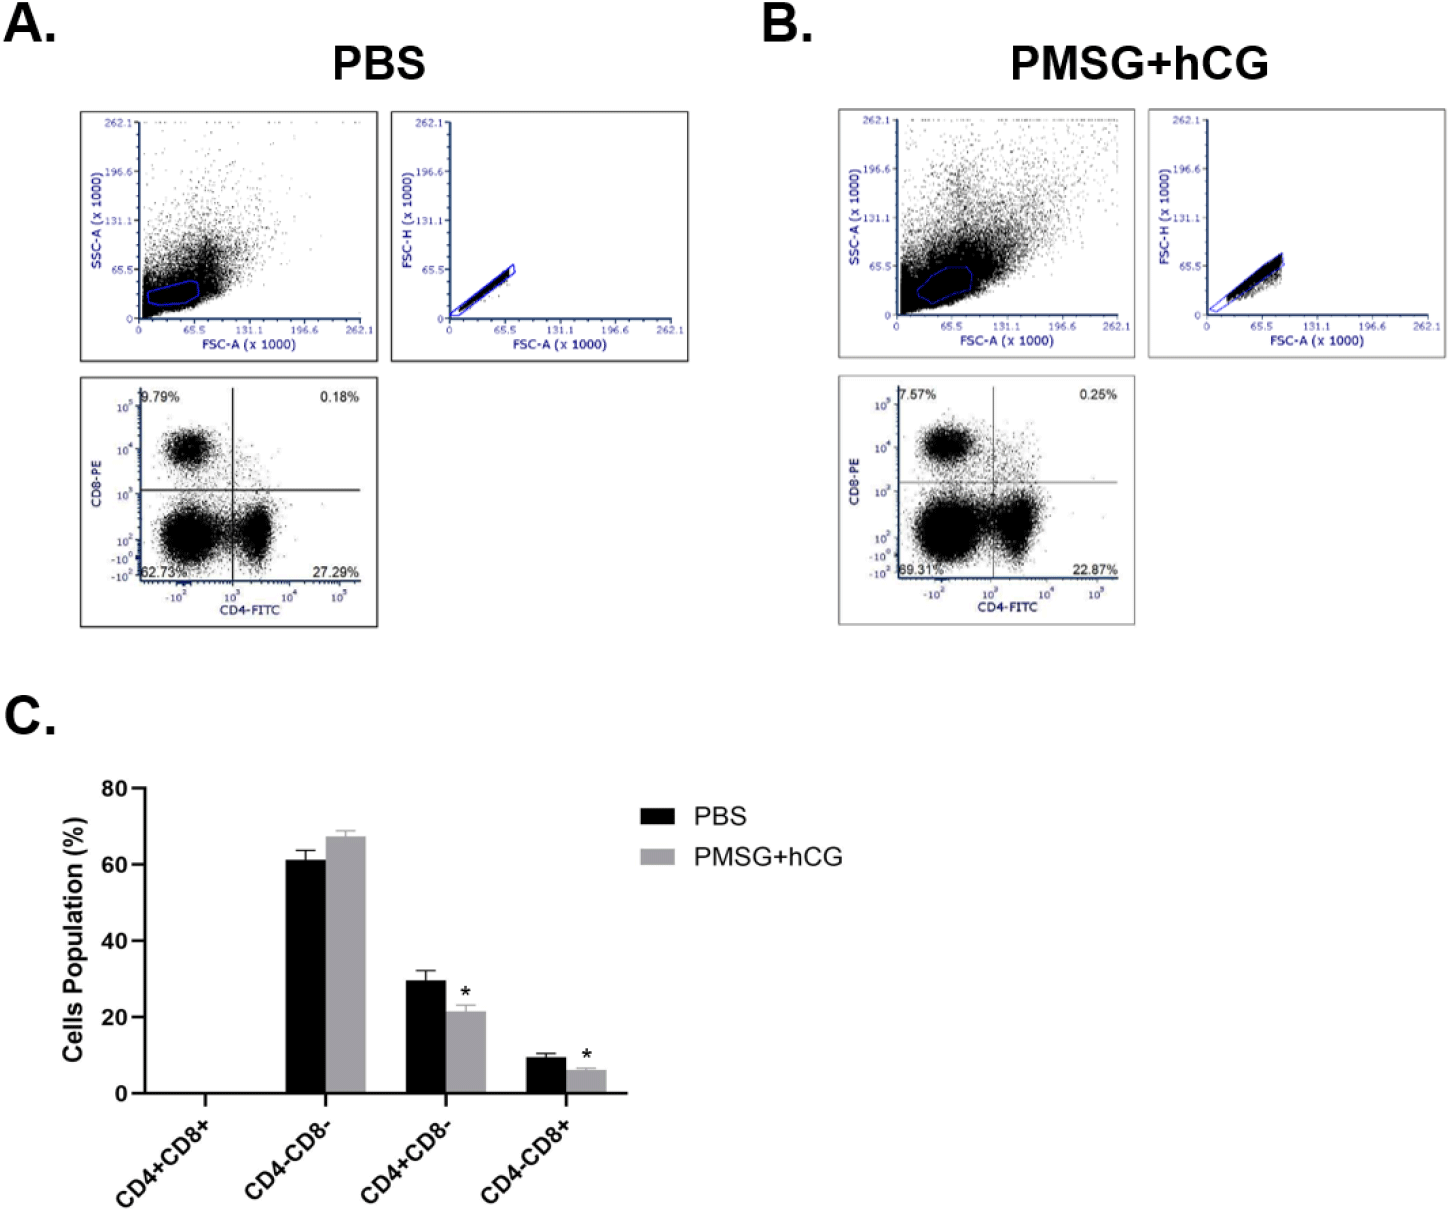
To observe the distribution of T cell populations in the spleen, splenocytes were isolated from mice injected with PBS or PMSG and hCG, and then T cell populations were analyzed based on surface markers. In the PBS-treated group, the proportions of CD4+CD8−, CD4+CD8+, CD4− CD8+, and CD4−CD8− T cells were 9.79±0.59%, 0.18±0.02%, 27.29±0.74%, and 62.73±1.26%, respectively (Fig. 4A). In the PMSG- and hCG-treated group, these proportions were 7.57±1.07%, 0.25±0.02%, 22.87.±0.26%, and 69.31±1.12%, respectively (Fig. 4B). The CD4−CD8− T cell population was overwhelmingly predominant in both groups, with a slightly higher proportion in the PMSG- and hCG-treated group. Conversely, the CD4+CD8− T cell population was negligible in both groups. In addition, the proportion of CD4+CD8− and CD4−CD8+ T cells was significantly reduced in the PMSG- and hCG-treated group compared to that in the control group (Fig. 4C).

DISCUSSION
High doses of FSH and hCG are often given to infertile patients to stimulate the production of multiple oocytes during IVF-ET procedures. If pregnancy does not occur, these treatments are repeated at intervals of several months. Based on this, we hypothesized that repeated administration of gonadotropins during IVF-ET procedures may affect the female immune system. Therefore, we investigated whether repeated administration of gonadotropins could alter thymic structures and impair T cell maturation, potentially affecting immune responses in mice.
First, we stained thymic sections with H&E and observed the thymic structure after the repeated administration of PMSG and hCG. In the PMSG- and hCG-treated group, the boundary between the cortex and medulla appeared relatively unclear and the cortical area was wider. In addition, the cell density was lower than that in the PBS-treated control group. Fat deposits were observed in the interstitial space, and the vascular distribution was less distinct than that in the control group. During thymic atrophy, epithelial cell density decreases, fat cells replace thymic tissue, and the vascular structure becomes blurred, leading to reduced blood flow and impaired microenvironmental function (Aw & Palmer, 2011). This suggests that the repeated administration of PMSG and hCG may contribute to thymic atrophy and potentially reduce thymic function.
Next, we examined the expression of adipogenesis-related genes such as PEPCK, aP2, and PPARγ after repeated administration of PMSG and hCG to determine whether administration of PMSG and hCG induced adipogenesis in the thymus. PEPCK plays a critical role in glucose production and regulation of energy metabolism (Hanson & Garber, 1972). An increase in PEPCK mRNA expression may indicate elevated metabolic activity due to the activation of immune cells in the thymus and may also be associated with the activation of other pathways, such as fatty acid oxidation (Franckhauser et al., 2002). Similarly, aP2, also known as fatty acid binding protein 4 (FABP4), is involved in fatty acid transport (Coe & Bernlohr, 1998) and is closely associated with inflammation and metabolic stress (Makowski et al., 2001). PPARγ plays a key role in adipocyte differentiation, lipid metabolism (Rosen & Spiegelman, 2001), and energy homeostasis in adipose tissue (Tontonoz & Spiegelman, 2008). In our study, the significant increase in the mRNA expression of adipogenic genes in the thymus may represent an early indicator of thymic involution, a process in which thymic degeneration or aging promotes differentiation into adipocytes, leading to thymic adipose tissue formation. These results are consistent with those of a previous study showing that repeated administration of gonadotropins increases the expression of PEPCK, aP2, and PPARγ, thereby stimulating thymic adipogenesis, which is closely associated with structural and functional changes in the thymic tissue (Youm et al., 2020).
In addition to adipogenesis-related genes, the mRNA expression of epithelial cell marker genes such as AIRE, IL-7, and EVA was analyzed. AIRE is expressed in medullary epithelial cells of the thymus, whereas EVA and IL-7 are expressed in thymic mesenchymal epithelial cells (mTECs) (Alves et al., 2009). Our results showed no significant differences in the expression of AIRE, which plays a crucial role in autoimmune regulation, between the control group injected with PBS and the group injected with PMSG and hCG. In addition, there was no change in the expression of IL-7, which is essential for the development and survival of T cells in the thymus. Although there was a slight increase in EVA mRNA expression in the PMSG- and hCG-treated group, this difference was not statistically significant. These results are consistent with those of a previous study showing that repeated administration of PMSG and hCG has no significant effect on the prevention of autoimmune reactions or the survival and proliferation of TEC (Suniara et al., 2000).
Next, we analyzed the distribution of CD4+ and CD8+ T cells in the thymus using flow cytometry to investigate how repeated administration of PMSG and hCG affects T cell composition and development in the organ. T cell development is a well-characterized process that begins with double negative (DN, CD4−CD8−) cells, progresses through the double positive (DP, CD4+CD8+) stage, and culminates in the generation of single positive (SP, CD4+CD8− or CD4− CD8+) T cells (Murphy et al., 2016). DN T cells represent immature progenitor cells, DP T cells represent intermediate developmental stages, and SP T cells represent mature T cells (Park et al., 2020). Our results showed that DN T cells were significantly increased in the PMSG- and hCG-treated group compared to the control group, but were low in both groups. In contrast, the DP T cells, which were the most abundant T cell subset in both groups, were significantly decreased in the PMSG- and hCG-treated group. These results suggest an effect of PMSG and hCG administration on the earliest stages of T cell development. In addition, the number of SP T cells were slightly increased in the PMSG- and hCG-treated group compared to that in the control group, but these differences were not statistically significant. The lack of significant changes in SP populations suggests that while early T cell development is affected, the final maturation and differentiation of T cells remain largely unaltered. Taken together, these findings provide insight into the specific effects of PMSG and hCG on T cell development in the thymus, highlighting significant changes at the DN and DP stages of T cell development in the thymus, while suggesting resilience in SP T cell maturation.
To further elucidate the effects of PMSG and hCG administration on early T cell development in the thymus, we analyzed the distribution of CD25+ and CD44+ T cells, which serve as markers of different stages of DN T cell development. CD44+CD25− are associated with activated memory T cell precursors, CD44+CD25+ are primarily expressed on regulatory T cell (Treg) precursors or early stage T cells, and CD44−CD25− are indicative of early immature T cells (Porritt et al., 2004; Seddiki et al., 2006). Our study showed a significant increase in the population of CD44+CD25− T cells in the PMSG- and hCG-treated group compared to that in the control group. This finding suggests an expansion of activated memory T cell precursors, possibly reflecting increased immune activation (Sallusto et al., 2004). While this could indicate an enhanced immune response, it could also indicate an increased predisposition to autoimmune disease or excessive immune activation (Kumar et al., 2018). In contrast, CD44+CD25+ and CD44−CD25− T cells did not show a significant decrease in the PMSG- and hCG-treated group, indicating the absence of substantial changes in regulatory T cells or early immature T cells.
Next, we analyzed the distribution of CD4+ and CD8+ T cells in the spleen after PMSG and hCG administration. As expected, no CD4+CD8+ T cells were detected in the spleens. The proportion of CD4−CD8− cells, which are not T cells, was slightly increased in the PMSG- and hCG-injected group compared to the PBS-injected group, although this change was not statistically significant. In contrast, the population of CD4+CD8− and CD4−CD8+ T cells was significantly reduced in the PMSG- and hCG-injected groups. CD4+CD8− T cells function as helper T cells, facilitating antibody production, whereas CD4−CD8+ T cells function as cytotoxic T cells, and are responsible for eliminating infected cells (Gutcher & Becher, 2007). These reductions in CD4+CD8− and CD4−CD8+ T cells in the spleen after repeated administration of PMSG and hCG suggest that this may impair the immune response.
In this study, we demonstrated that repeated administration of PMSG and hCG directly affected the immune system by significantly altering T cell development in the thymus and spleen. The observed alterations in T cell developmental stages suggest impaired or incomplete T cell differentiation within these immune organs, which may contribute to aberrant immune responses. From the perspective of female reproductive function, these results suggest that a decrease in implantation-associated T cells may interfere with successful implantation. Furthermore, gonadotropins, which are commonly administered in repeated doses during IVF-ET procedures, may affect immune function in infertile patients. Given the critical role of the immune system in reproductive processes, a thorough understanding of how gonadotropins interact with both immune and reproductive systems is essential. The potential for immune-related side effects, such as disrupted T cell development in immune organs, underscores the need for careful evaluation of current gonadotropin regimens. Based on these findings, it is essential to develop safer and more effective treatment protocols that minimize immune-related side effects while optimizing pregnancy success rates in IVF-ET. Future research should focus on elucidating the precise mechanisms by which gonadotropins influence immune function and identifying therapeutic approaches that preserve immune homeostasis during fertility treatment.
