INTRODUCTION
The marine medaka, Oryzias dancena (Beloniformes; Teleostei), is a euryhaline teleost that mainly inhabits the brackish or freshwater of river mouths and estuaries around Bengal Bay and the Malay Peninsula (Roberts, 1998). It also has a short interval between generations, with spawning possibilities just 60 days after hatching (Kim et al., 2009a; Goo et al., 2015). Most of its physiological attributes are similar across a wide spectrum of salinities, ranging from complete freshwater to normal seawater (Inoue & Takei, 2003; Kang et al., 2008; Goo et al., 2015). The marine medaka isn’t indigenous to Korea. However, this species is accredited by the Ministry of Land, Transport and Maritime Affairs, Korea (Ordinance of Agriculture, Food and Fisheries, No. 1) and is imported legally from Indonesia (Kim et al., 2009a, 2009b). Recently, the Institute of Marine Living Modified Organisms (iMLMO) selected this species for a living modified organism evaluation project. In line with this purpose, detailed information on marine medaka biology has begun to be exploited, especially regarding early gonadogenesis, sex differentiation, early ontogenesis, and embryogenesis (Kim et al., 2009a, 2009b). In addition, Nam et al. (2010) researched tolerance capacity to salinity changes in this species. This species is highly capable of hyper-osmoregulation as well as hypo-osmoregulation. Also, no marine medaka in the experimental group (0 to 40 ppt) died from stress of salinity changes (Nam et al., 2010).
An effective high-density transport method for fish is essential to minimize stress and reduce the chance of mass mortality (Ferreira et al., 1984) during long periods of transportation and handling, and to reduce expenses and avoid losses (Ferreira et al., 1984; Staurnes et al., 1994). The production of new equipment and transport procedures has had increasingly positive effects on the transportation of live fish. In addition, anesthetics are also effective method of transporting fish. Because, the use of anesthetics in aquaculture reduces fish energy, allowing for the efficient transportation of fish, ease of handling when measurements are taken, a reduction in the pain and trauma experienced by experimental fish, and reduced handling stress (Park et al., 2009; Gil et al., 2016). For example, the use of nonpoisonous salt has been shown to alleviate stress and promote higher survival rates (Tomasso et al., 1980; Carmichael et al., 1984; Carmichael & Tomasso, 1988; Gil et al., 2016). The use of low-concentration calcium chloride is a cheap and effective method of handling and transporting live fish (Grizzle et al., 1985; Carmichael & Tomasso, 1988).
In recent years, Park et al. (2014) reported that anesthe-tic effect by changing water temperature (cold shock and heat shock). Temperature shock anesthesia in fish is characterized by an absence of motion, reduced power of exertion, and diminished nervous sensitivity. Temperature shock anesthesia is reversible and leaves no residue in the tissues. No danger is imposed to the user, other than the risk inherent in handling solid carbon dioxide if that material is used (Park et al., 2014). But temperature shock anesthesia has short anesthetic time for handling samples. Mass mortality of samples may cause by this method, because process of this method is to faint by temperature shock. Therefore, based on the fact that it is safe, inexpensive, non-toxic to the environment and stable, and does not require a withdrawal period compared to other synthetic-based anesthetics, the use of clove oil and lidocaine-HCl has become more popular in the aquaculture industry (Kang et al., 2005; Park et al., 2011). The effects of clove oil and lidocaine-HCl as anesthetics have been studied in a number of fish species (Woody et al., 2002; Park et al., 2004, 2009, 2011; Gil et al., 2016).
However, previous research on marine medaka has investigated the effects of anesthetic clove oil and lidocaine-HCl on water temperature and anesthetic effects of changing water temperature and stress responses in the marine medaka (Park et al., 2011; Park et al., 2014). No previous research has investigated the anesthetic effects of clove oil and lidocaine-HCl on the marine medaka during transportation. We have determined the aim of this research should concern a euryhaline teleost, so the marine medaka was chosen. The aim of this study was to determine optimum concentrations of anesthetic clove oil and anesthetic lidocaine-HCl for the marine medaka in various salinity conditions, and analyzing various physiological and water parameters by a simulation experiment in optimum salinity condition.
MATERIALS AND METHODS
On 12 January 2009, 30 specimens of adult marine medaka, Oryzias dancena were obtained from iMLMO, Pukyung National University, Korea. The fish were reared and bred in the Fishery Genetics and Breeding Sciences Laboratory of the Korea Maritime University. Ten thousand specimens of adult marine medaka were bred from the original 30 specimens in 11 months. The marine medaka used in the study were selected at random from the entire population. Samples were measured using an electronic balance (Shimadzu, Japan) and vernier caliper (Mitutoyo, Japan). Average body length and body weight of the group were 30.8±3.52 mm (n = 50) and 334.9±60.04 mg (n = 50), respectively.
The anesthetic experiment began on 29 December 2015 and ended on 20 February 2016. Fifty specimens from each of the groups were randomly selected for respective experiment to investigate the anesthetic effects of clove oil (Sigma, USA) and lidocaine-HCl (Hongsung Chemical, Korea). Five water salinities, 0, 10, 20, 30, and 40 ppt, were set for the study and anesthetic water salinity was identical with recovery water salinity. Water salinity of each group was regulated to be same as the anesthetic water salinity during the experiment. Until experiment termination, the water temperature was maintained at 26℃. All the fish were deprived of food for 24 hours before the study. The study methods for the anesthetic effect of clove oil and lidocaine were taken from the methods of Park et al. (2011). Furthermore, all experiments were completed in duplicate.
The decision-based anesthetic effect table shows the stages of anesthesia and recovery that were used as endpoints (only opercular movement: A6; normal swimming, responsiveness to visual stimuli: R6) in the present study (Summerfelt & Smith 1990; Woolsey et al., 2004; Park et al., 2011). During this experiment, anesthetizing marine medaka involved several stages, from slowed swimming speed and side to side rolling (stage A2) to only opercular movement (stage A6). At stage A6, individuals were transferred to a recovery tank. Recovery time was established as the point at which erratic swimming began. Recovery time included redressing the balance (stage R5) and normal swimming, as well as responsiveness to visual stimuli (stage R6).
After anesthetic experiment, a simple sealed container, comprising an acrylic resin box with a wall thickness of 8 mm and overall dimensions of 10 cm (width)×50 cm (length)×10 cm (height), was used as a respirometer chamber. The hose for the inflow water was equipped with a temperature controller and 10 µm and 3 µm cartridge filters to exclude any particles. A flow-through ultraviolet lamp was used to reduce the oxygen consumption by microbes. The temperature of the water flowing into the respirometer chamber was maintained at 26±0.3℃ with a heater. The water salinity was maintained optimum anesthetic salinity by brackish water, and optimum anesthetic salinity of each group were analyzed by anesthetic experiment. The respirometer chambers were prepared and labeled according to the measurement times and anesthetic concentrations.
For determine the appropriate experimental concentrations of clove oil and lidocaine-HCl, we performed a pilot experiment for 48 hours. To prevent mortality in the experimental sample, the anesthetized marine medaka were maintained at several levels of anesthesia during the pilot study, ranging from normal swimming, opercular movement, and general movement (stage A1) to slow swimming and side-to-side rolling (stage A2) (Summerfelt & Smith, 1990; Woolsey et al., 2004; Park et al., 2011). The anesthetic effects of clove oil were determined at five concentrations: 0.2, 0.4, 0.6, 0.8, and 1 ppm. The stock solution of clove oil was dissolved in 95% methanol (Sigma, St. Louis, USA) at a ratio of 1:10. The effects of lidocaine-HCl were determined at five concentrations: 20, 40, 60, 80, and 100 ppm. To neutralize the anesthetic solution (lidocaine-HCl solution) and to amplify its effect (Park et al., 2011), Na-HCO3 (Sigma, St. Louis, USA) at a total concentration of 1,000 ppm was added to the solution.
Measurements were made at 6 hours intervals after experiment was begun, for 48 hours. Before the dissolved oxygen (DO) was measured, the concentrations of ammonium (NH4+) and carbon dioxide (CO2) were measured with a spectrophotometer (DR2800, HACH, Loveland, Colorado, USA) and the respiratory frequencies (gill cover movements) of the fish were measured with a counter and a digital timer. DO was measured with an oxygen electrode and a multidata logger system (Oxyguard, Denmark).
RESULTS
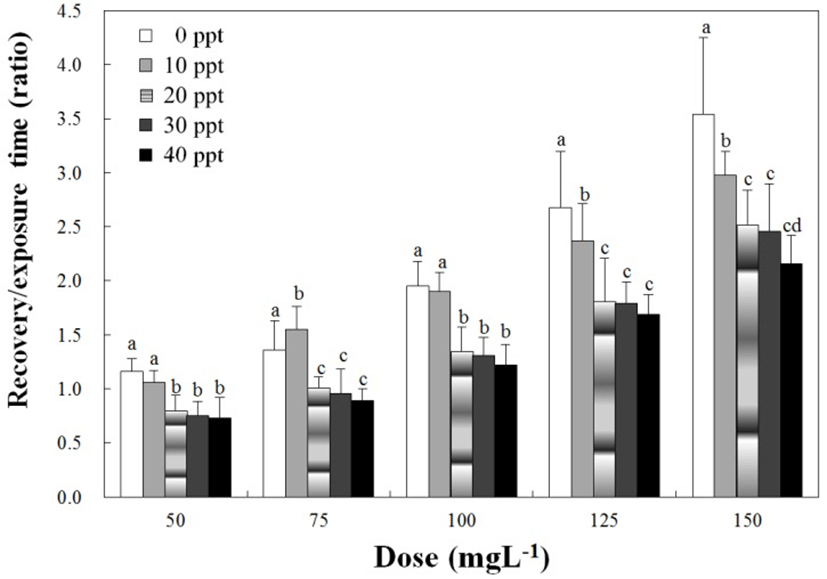
No fish died from stress due to anesthesia during this anesthetic experiment. Table 1 shows the anesthetic effects of clove oil at each concentration and water salinity. Anesthetic time was significantly affected by water salinity and clove oil concentrations, and decreased drastically as the concentration of clove oil increased (P<0.05). However, the anesthetic effects on water salinity show a different trend. Anesthesia times increased in the other salinities excepted for 0 ppt. Furthermore, at each salinity concentration, the anesthetic time at 10 ppt was faster than the other salinities. In addition, the pattern of recovery time was similar to that of anesthetic time (P<0.05). With the exception of 0 ppt, recovery time increased gradually at all other salinities. At 10 ppt, the recovery time at each salinity concentration was faster than the other salinities. It is important to note that the recovery times of clove oil in each concentration were similar that each salinity. Fig. 1 shows the concentration of clove oil and the ratios of recovery times in relation to anesthesia time relative to the water salinity. In terms of trends, the ratio of recovery time to anesthesia time gradually increased as clove oil concentration increased at each water salinity group (P<0.05). However, at each clove oil concentration, the ratio of the recovery time to anesthesia time in relations to the water salinity decreased with the exception of 75 ppm (P<0.05).

Table 2 shows the anesthetic effects of lidocaine-HCl at each concentration and water salinity. At each salinity, the anesthesia time decreased drastically as the concentration of lidocaine-HCl increased (P<0.05). The anesthesia time increased as water salinity increased between 200 ppm and 400 ppm. At other concentrations, the pattern of lidocaine-HCl was similar to that of clove oil. Recovery time exhibitted a similar pattern, but the anesthesia time pattern differed. As the concentration of lidocaine-HCl increased, recovery time at each concentration decreased at each salinity group. At 0 ppt, the recovery time at each concentration was slower than at any other salinity. However, at 10 ppt, the recovery time was faster than at any other salinity. At water salinities over 20 ppt, recovery time decreased as water salinity increased (P<0.05).
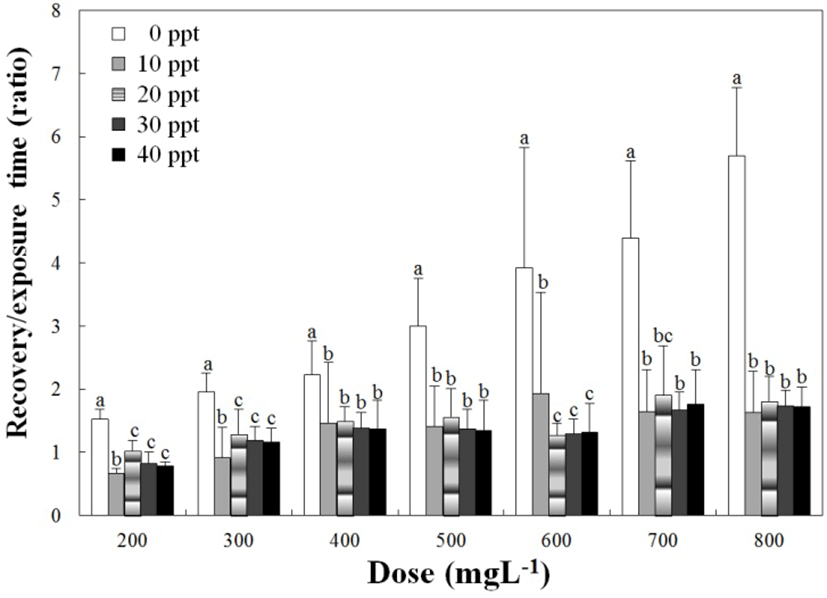
Fig. 2 shows the concentrations of lidocaine-HCl and recovery time ratios in relation to anesthesia time according to water salinity. In terms of trends, the ratio of recovery time to anesthesia time gradually increased as the lidocaine-HCl concentration increased at each water salinity group (P<0.05). However, at each lidocaine-HCl concentration, the ratios of recovery time to anesthesia time according to water salinity were different from the clove oil trend. At 0 ppt, the ratio of recovery time to anesthesia time was higher than other salinities. Moreover, at all salinities excepted for 0 ppt, the ratios of t recovery time to anesthesia time were similar (P<0.05).

At each concentration of clove oil and lidocaine-HCl, fish were anesthetized slower at water salinities over 10 ppt. Anesthesia time at 10 ppt was faster than at any other salinity. With the exception of 10 ppt, relationships between water salinity and anesthesia time presented a positive gradual curve, with increased water salinity (over 10 ppt) resulting in increased anesthesia time. Such a proportional relationship has not been found in previous studies. For this species, lower salinity resulted in significantly shorter anesthesia induction from clove oil and lidocaine-HCl (P<0.001).
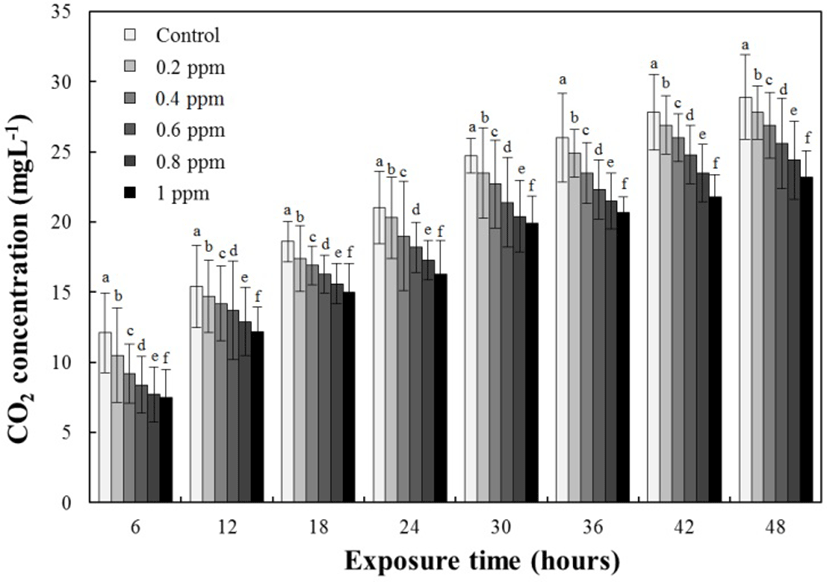
The results for the DO concentrations, the respiratory frequencies, and the NH4+ and CO2 concentrations in the clove-oil-administered groups are presented in Tables 3, 4, and 5 and Fig. 3, respectively. The DO concentrations and the respiratory frequencies decreased in all the experimental groups up to 48 hours (P<0.05; Tables 3 and 4, respectively), whereas the NH4+ and CO2 concentrations in all the experimental groups increased up to 48 hours (P<0.05; Table 5 and Fig. 3, respectively). At 6 hours, both the DO and NH4+ concentrations and the respiratory frequencies had decreased with increasing clove oil concentrations (all P<0.05). At 6 hours, CO2 was 12.1±2.83 ppm for the control group, 10.5±3.35 ppm for the 0.2 ppm clove oil group, 9.2±2.13 ppm for the 0.4 ppm clove oil group, 8.4±2.01 ppm for the 0.6 ppm clove oil group, 7.7±1.99 ppm for the 0.8 ppm clove oil group, and 7.5±1.97 ppm for the 1 ppm clove oil group. At 12 hours, the DO, NH4+, and CO2 concentrations and respiratory frequencies had decreased with increasing clove oil concentrations. The CO2 concentration at 12 hours was 15.4±2.95 ppm for the control group, 14.7±2.59 ppm for the 0.2 ppm clove oil group, 14.2±2.67 ppm for the 0.4 ppm clove oil group, 13.7±3.54 ppm for the 0.6 ppm clove oil group, 12.9±2.44 ppm for the 0.8 ppm clove oil group, and 12.2±1.75 ppm for the 1 ppm clove oil group. At all other times (18, 24, 30, 36, 42, and 48 hours), the trends in the DO, NH4+, and CO2 concentrations and the respiratory frequencies for the control and clove-oil-administered groups were similar to those at 6 and 12 hours.

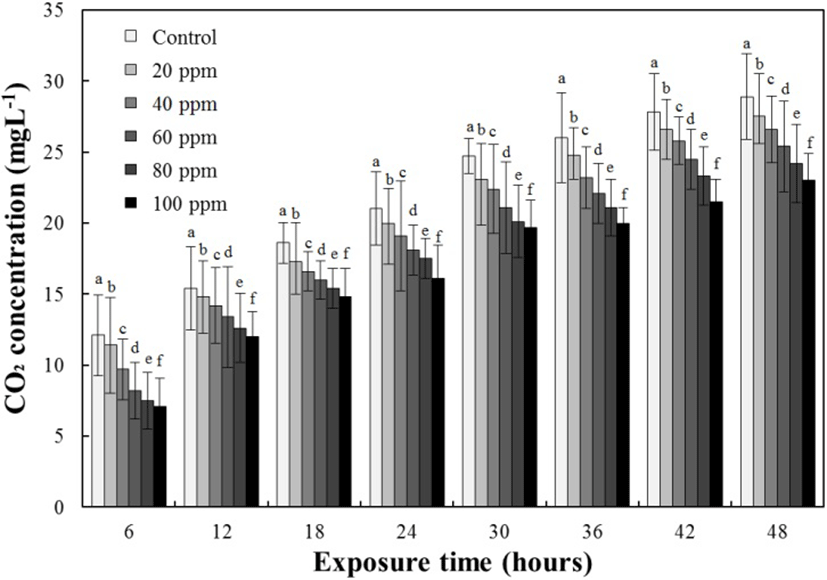
The results for the DO concentrations, respiratory frequencies, and NH4+ and CO2 concentrations in the lidocaine-HCl-administered groups are presented in Tables 6, 7, and 8 and Fig. 4, respectively. The DO concentrations and respiratory frequencies decreased up to 48 hours in all experimental groups (P<0.05; Tables 6 and 7, respectively), whereas the NH4+ and CO2 concentrations increased up to 48 hours in all the experimental groups (both P<0.05; Table 8, Fig. 4). At 6 hours, the DO, NH4+, and CO2 concentrations and the respiratory frequencies had all decreased with increasing lidocaine-HCl concentrations (P<0.05). The CO2 concentration at 6 hours was 12.1±2.83 ppm for the control group, 11.4±3.57 ppm for the 20 ppm lidocaine-HCl group, 9.7±2.39 ppm for the 40 ppm lidocaine-HCl group, 8.2±2.12 ppm for the 60 ppm lidocaine-HCl group, 7.5±1.68 ppm for the 80 ppm lidocaine-HCl group, and 7.1±1.84 ppm for the 100 ppm lidocaine-HCl group. At 12 hours, the DO, NH4+, and CO2 concentrations and the respiratory frequencies had all decreased with increasing lidocaine-HCl concentrations. The CO2 concentration at 12 hours was 15.4±2.95 ppm for the control group, 14.8±2.51 ppm for the 20 ppm lidocaine-HCl group, 14.2±2.15 ppm for the 40 ppm lidocaine-HCl group, 13.4±3.64 ppm for the 60 ppm lidocaine-HCl group, 12.6±2.11 ppm for the 80 ppm lidocaine-HCl group, and 12.0±1.15 ppm for the 100 ppm lidocaine-HCl group. At all other times (18, 24, 30, 36, 42, and 48 hours), the trends in the DO, NH4+, and CO2 concentrations and respiratory frequencies for the control and lidocaine-HCl-administered groups were similar to those at 6 and 12 hours.

DISCUSSION
Study results indicate that the higher the concentration of anesthetic at each salinity, the shorter the anesthesia time at each salinity. The patterns of clove oil and lidocaine-HCl observed in the marine medaka are similar to previous studies on other bony fishes such as the sockeye salmon, Oncorhynchus nerka, (Woody et al., 2002) the rock bream, Oplegnthus fasciatus (Park et al., 2009), the greenling, Hexagrammos otakii (Park et al., 2003), and the winter flounder, Pleuronectes americanus (Park et al., 2004). The dose response of the marine medaka to clove oil and lidocaine-HCl presented a negative exponential curve, with increased doses resulting in decreased time until the anesthesia stage A6.
Optimum anesthetic concentrations are usually expected to induce anesthesia within 3 min and recovery within 10 min (Son et al., 2001; Park et al., 2003). For this study, it was decided that the optimum anesthesia concentration should be at about 1 min. Considering that the optimal anesthesia time is around 1 min, concentrations of clove oil for the marine medaka were 150 ppm at 0 ppt, 20 ppt, and 30 ppt, and 100 ppm at 10 ppt. The optimal anesthesia concentrations of lidocaine-HCl on the marine medaka were 800 ppm and 700 ppm at 0 ppt and 10 ppt, respectively. At 10 ppt, the optimum anesthetic concentration of clove oil and lidocaine-HCl for the marine medaka was similar to that found in a previous study on the marine medaka and water temperature (Park et al., 2011). Park et al. (2011) also reported that the optimum anesthetic concentration of both anesthetics at 26 ℃ was 100 ppm and 700 ppm, respectively.
If the ratio of recovery time to anesthetic time is greater than 1, the recovery time is longer than the anesthesia time. For the clove oil, the ratio is less than 1 at 50 ppm, 100 ppm in 20 ppt, 30 ppt and 40 ppt. Other data were recorded greater than 1 and, at each water salinity, the ratio of recovery time to anesthesia time increased as the anesthesia concentration was increased (P<0.05). That is, anesthesia time was shortened as anesthesia concentration increased, but recovery time increased relatively. On the contrary, anesthesia time increased as anesthesia concentration was reduced, but recovery time was shortened relatively (P<0.05). A similar result was reported for the rock bream (Park et al., 2009) in that the increment of clove oil concentration corresponds to the increment of ratio of recovery time to anesthesia time. For lidocaine-HCl, the ratio is less than 1 at 200 ppm in 30 ppt and 40 ppt. Other ratios of recovery time to anesthesia time are greater than 1. This means that recovery time is longer than the anesthesia time for lidocaine-HCl. No other specific regulation was found from this result.
For specific details of this research, anesthesia time and recovery time were fastest at 10 ppt. Anesthesia of fish is accomplished through the gills. High metabolism causes rapid breathing. If metabolism is high, the anesthesia is absorbed faster through the gills (Summerfelt & Smith, 1990). Thus, metabolism of the marine medaka at 10 ppt is expected to be higher than at any other salinity. Results show that anesthetic time and recovery time at 10 ppt are faster than other salinities for further confirmation, comparative physiology research needs to be undertaken to determine these details.
The patterns of DO decline in the water of the control groups, the clove-oil-administered groups, and the lidocaine-HCl-administered groups are consistent with the trends reported in studies of Rhynchocypris steindachneri, olive flounder, Paralichthys olivaceus, and winter flounder, Pleuronectes americanus (Ko et al., 1995; Park et al., 1998; Park et al., 2009). Based on these results, we can assume that the high oxygen consumption during the early stage of transportation is attributable to the high levels of stress induced by handling or netting. The results of this study are similar to those of a transportation experiment by Ferreira et al. (1984), in which benzocaine-HCl was used as an anesthetic for the Java tilapia, Oreochromis mossambicus. In general, both studies showed a reduction in fish metabolism after the application of the anesthetic, which is an indication of declining oxygen consumption. In this study, there seemed to be a positive relationship between the concentrations of lidocaine-HCl and DO, insofar as the group treated with the highest concentration of anesthetic exhibited the smallest decline in DO (Ferreira et al., 1984). A similarly designed experiment by Park et al. (1998), with R. steindachneri as the test organism, showed that the trends in DO and ventilation rates exhibited the same patterns for 2 h as were observed for 3 h in our study. Park et al. (1998) used lower lidocaine-HCl concentrations (5, 10, and 20 ppm), but at a lower temperature (18℃ compared with the 26℃ we used in this experiment), which ultimately produced nearly identical trends. This is an important comparison, because it indicates the wide-ranging effects of lidocaine-HCl over a broad spectrum of temperatures.
Guo et al. (1995) performed a transportation experiment on the playfish, Xiphophorus maculatus (Günther), treated with three different anesthetics: 2-phenoxyethanol (200 ppm), quinaldine sulfate (10 ppm), and MS-222 (30 ppm). At 16 hours after the administration of the anesthetic, the NH4+ concentration in the water of the 2-phenoxyethanol group was only 65% that of the control group, 20% that of the quinaldine sulfate group, and relatively lower concentration compared with that of the MS-222 group. The trends in ammonium concentrations exhibited by the five experimental groups were consistent with the trends reported by Park et al. (1998, 2009) and Guo et al. (1995). Our conclusions are in accord with those of Park et al. (1998, 2009), insofar as the overall reduction in NH4+ excretion was directly related to the anesthetic-induced decline in metabolism.
Lidocaine-HCl induced the expected anesthetic effects for teleost fish in terms of their increased sedation, which is associated with a reduced metabolic rate and reduced oxygen consumption, together with reduced production of both NH4+ and CO2 (McFaland, 1959; Park et al., 1998, 2004, 2009). Currently, MS-222 remains the only fish anesthetic approved by the FDA for the United States (Schnick & Meyer, 1978). However, fish treated with MS-222 are not edible until 21 days after its administration, which is the withdrawal period required for traces of the chemical to disappear from the flesh of the fish (Carmichael & Tomasso, 1988). This clearly raises operational issues because the fish cannot be harvested for three weeks.
This study shows that clove oil and lidocaine-HCl are effective techniques for anesthetizing the marine medaka. Moreover, the relationship between anesthetic effect and water salinity was examined. The two anesthetics used in this study meet the requirements of an ideal anesthesia with 3 min anesthesia times and 5 min recovery time. As mentioned by Park et al. (2011), the anesthetic effect is significantly affected by the water temperature and the clove oil or lidocaine-HCl concentration, and decreases proportionally as the clove oil or lidocaine-HCl concentration or water temperature increases. The results of Park et al. (2011) suggest that the anesthetic effects of clove oil are similar to those of lidocaine-HCl. The results of our experiment suggest that clove oil and lidocaine-HCl both reduce the metabolic activity of the marine medaka, Oryzias dancena, thus reducing its ammonium excretion and its oxygen consumption. Both anesthetics are cost-effective, efficient, safe and non-toxic to the fish and the user (Park et al., 2003).
Park et al. (2014) reported that the operculum movement number increased under heat anesthesia and cold anesthesia by changing temperature. With anaesthetization at either 38°C or 8°C, the whole-body cortisol level was highest at 0 hour and decreased gradually until 6 hours, whereas the whole-body glucose level was highest at 1 hour and decreased until 2 hours (Park et al., 2014). In conclusion, clove oil and lidocaine-HCl have been shown to be effective anesthetics, improving the transportation of the marine medaka. Results from this study will contribute to safe laboratory handling of the marine medaka, which are commonly required for use by many research studies and experiments. The results of our study should be useful for aquaculturists and transporters who require that minimal stress is imposed on fish during transport. In this study, we were not analyzed change of physiological response by clove oil and lidocaine-HCl anesthesia. So, future investigations on the marine medaka should focus on comparative analysis of physiological reactions by salinity and anesthetics.
