INTRODUCTION
Early growth response-1 (Egr1), also known as Krox-24, NGFI-A, and Zif268, is a zinc finger transcription factor that was identified as an immediate-early serum response gene expressed in various physiological conditions (Milbrandt, 1987; Topilko et al., 1998). Egr1 belongs to Egr family of transcription factors encoding closely related transcription factors (Patwardhan et al., 1991). It is rapidly induced by various stimuli such as growth factors and cytokines. It can be expressed through activation of the protein kinase C and mitogen-activated protein kinase pathways (Gashler and Sukhatme, 1995). These pathways are activated by gonadotropin releasing hormone (GnRH) in gonadotropes (Sundaresan et al., 1996; Reiss et al., 1997; Saunders et al., 1998).
Two independent Egr1 knock-out mice with overlapped and distinct phenotypes have been produced (Lee et al., 1996; Topilko et al., 1998). Two different cell lineages expressing Egr1 in the pituitary are differentially affected by the mutation. Somatotropes present abnormal cytological features and are reduced in number, consistent with the decreased level of growth hormone observed in these animals. In contrast, gonadotropes are normal in number, but fail to synthesize the β-subunit of luteinizing hormone (LHβ). In the ovary, expression of LH receptor is down-regulated, indicating that Egr1 could act at two different levels of the pituitary-gonadal axis (Duan et al., 2002; Yoshino et al., 2002). While it is now clear that Egr1 is a critical transcription factor to regulate LHβ transcription in the pituitary, its function and target genes in other reproductive organs such as uterus have not been thoroughly investigated.
Egr1 acts as tumor suppressor by trans-activating major tumor suppressors, including transforming growth factor-β1, p53, and PTEN, indicating that Egr1 is a major tumor suppressor in numerous human cancers (Baron et al., 2006). For example, Egr1 expression is suppressed in non-small cell lung cancers and glioblastomas. Over-expression of Egr1 by recombinant adenovirus infection almost completely prevents the growth of tumor cells in vitro, regardless of the mutation of the p53 gene in breast cancer and small cell lung carcinoma (Calogero et al., 2004). Egr1 regulates transcription of heparanase in tumor cells by either repressing or activating transcription depending on types of cancers (de Mestre et al., 2005). Furthermore, Egr1 is induced by estrogen via ERK1/2-dependent activation of ELK-1 in MCF-7 breast cancer cells (Chen et al., 2004). However, the function and expression profiles of Egr1 have not been investigated in the uterus, a major target tissue of estrogen. Thus, it is critical to identify target genes whose transcription is directly regulated by Egr1 in the uterus for understanding function and estrogen-dependent regulation of Egr1 in the uterus. Here we suggest that multi-step in silico analyses with mRNA microarray data could be a useful tool to provide a list of genes with higher probability to be direct target genes of a transcription factor for further functional studies.
MATERIALS & METHODS
All mice used in this study were housed in the Animal Care Facility at the Gangnam CHA Medical Center, CHA University, according to institutional guidelines for laboratory animals. This study was approved by the Institutional Animal Care and Use Committee (IACUC, approval number 110005). Egr1 knockout mice were originally produced and kindly provided by Jeffrey Milbrandt at Washington University at St. Louis, MO, USA (Lee et al., 1996). Six to seven week-old Egr1(+/+) and Egr1 (–/–) female mice were ovariectomized (OVX), rested for 2 weeks, and then treated with 200 ng estrogen (17β-estrodiol, E2). Mice were sacrificed 3 h after E2 treatment and uterine tissues were collected for RNA preparation. Total RNA from each mouse was individually prepared and two RNA samples were pooled for each microarray. mRNA microarrays were performed with Illumina Mouse WG-6 V2 (48K) array (Illumina; San Diego, CA, USA). Microarrays were performed as triplicates for each genotype (n=6 mice per genotype). Significant Analyses of Microarray (SAM) was applied to select DEGs between Egr1(+/+) and Egr1(–/–) uteri after E2 treatment.
The promoter sequences of DEGs from –2000 to +200 [a reference point (zero) was transcription start site] were obtained from UCSC gene sorter (http://www.genome.ucsc.edu). MatInspector (http://www.genomatix.de) was applied to mouse promoter sequences to identify putative EBSs in the promoter regions of DEGs (Cartharius et al., 2005). Three most representative EBSs provided by MatBase in genomatix were utilized to identify putative EBS in promoter regions. All the promoter sequences from seven species, including mouse, rat, human, rhesus monkey, orangutan, horse and dog, were applied to Promo (http://alggen.lsi.upc.es) for analyzing sequence conservation of EBS among different species (Messeguer et al., 2002).
Total RNA was extracted from uteri of OVX Egr1(+/+) and Egr1(–/–) mice 3 h after estrogen treatment (200 ng/mouse) by using Trizol reagent (Ambion, Carlsbad, CA, USA) according to manufacturer’s protocols. The first-strand cDNA was synthesized from 2 μg of total RNA by using M-MLV reverse transcriptase and RNasin Ribonuclease inhibitor. For RT-PCR and real-time RT-PCR analyses, gene-specific primers were used as described in Table 1. The PCR conditions for all primers were as follows: hold for 10 min at 95°C, followed by each cycles which were determined by primer test consisting of denaturation at 95°C (30 sec), annealing at 60°C (30 sec), elongation at 72°C (1 min). The amplified products were subjected to electrophoresis on a 2% agarose gel. Real-time RT-PCR was performed using Real-time PCR detection system (Bio-Rad, Waltham, MA, USA) and iQ™ SYBR Green supermix (Bio-Rad). For comparison of transcript levels between samples, a standard curve of cycle thresholds for several serial dilutions of a cDNA sample was established and then used to calculate the relative abundance of each gene as previously described (Svaren et al., 2000). Values were then normalized to the relative amounts of rPL7 cDNA. All PCR reactions were performed in duplicate.

|
RESULTS
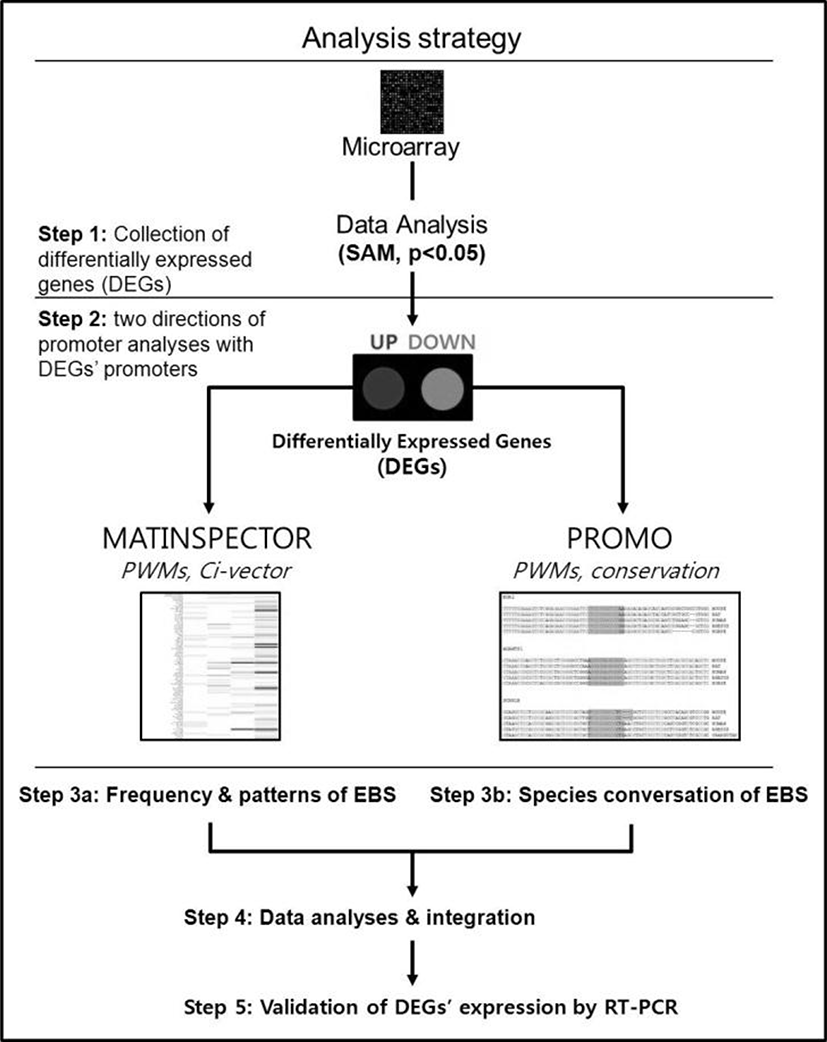
We have recently showed that Egr1 is rapidly and transiently induced by E2 and its expression reached maximal levels at 2 h after treatment in ovariectomized female mice (Kim et al., submitted). To identify direct target genes of Egr1 in the uterus, we have compared mRNA expression profiles in the uterus between wildtype and Egr1(–/–) mice 3 h after E2 treatment. SAM analysis at 1.5 fold change with statistical significance (p<0.05) provided 102 DEGs which are either up- or down-regulated in Egr1(–/–) uteri (Fig. 2A). The most representative sequences of EBS (Fig. 2B) were used to analyze promoter regions of DEGs. Promoter sequence analyses with MatInspector for proximal promoter regions of DEGs (~–2kb) showed that the number of EBS is quite different between DEGs. The number of EBS is represented as a heat map with a color spectrum from yellow (a few) to dark red color (many binding sites) (Fig. 2C). Whereas 87 of 102 DEGs have putative EBS in their promoter region (85.3%), 9 out 20 randomly selected non-DEGs have them (45%). These results suggest that EBS are significantly enriched in the promoters of DEGs than in those of non-DEGs (p<0.001).
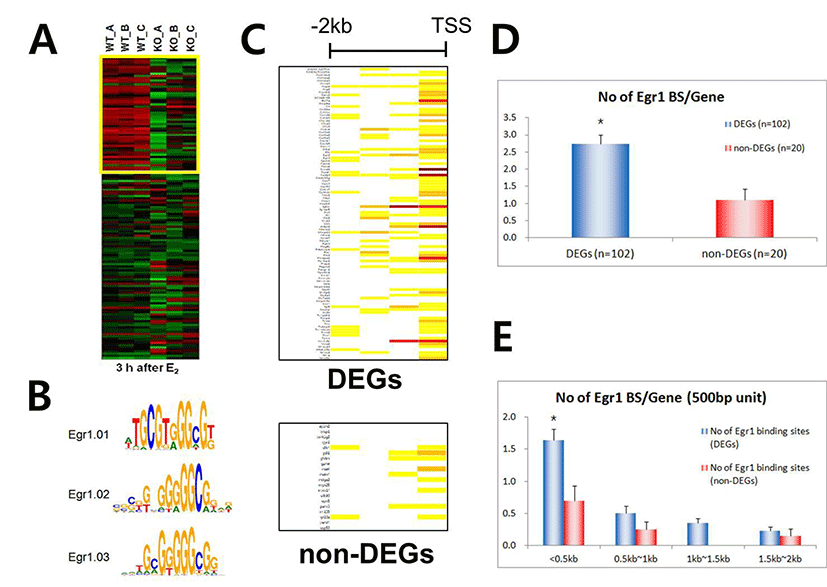
Whereas there are 2.7±0.26 EBSs within ~–2.0kb promoter regions of 102 DEGs, there are 1.1±0.32 in those of randomly selected non-DEGs (p<0.001), suggesting that the number of EBS is significantly enriched in the promoter regions of DEGs (Fig. 2D). In addition, ~60% EBS (179/298) of both DEGs and non-DEGs EBS are located within –0.5kb region of their promoters. Furthermore, the average number of EBS in –500 bp of DEG promoters is significantly higher than that of non-DEG (p<0.01), suggesting that –500 bp promoter is the critical region for EGR1 to regulate transcription of its direct target genes.
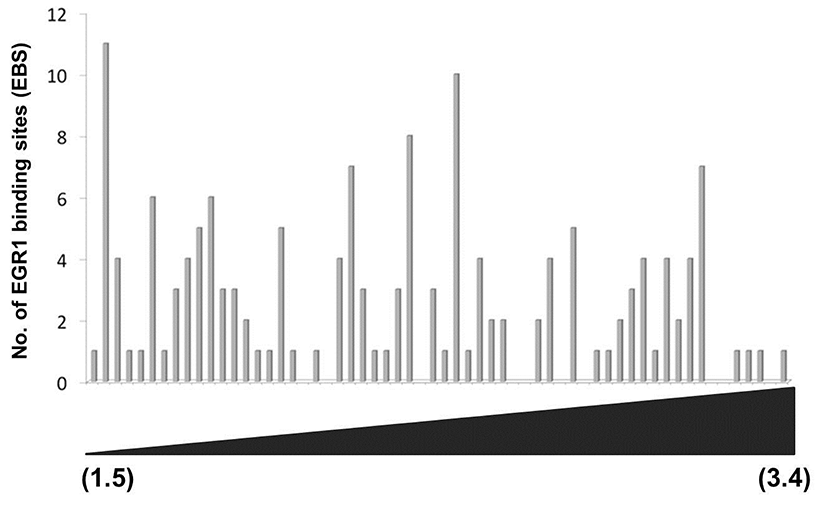
As shown in Fig. 2C, the promoter of each DEG has a wide spectrum with respect to the number of EBS. To examine whether the number of putative EBS in the promoters of DEGs is associated with expression levels of DEGs, fold changes of 60 down-regulated DEGs and the frequencies of EBSs on their promoters (~–2kb) were analyzed. Fig. 3 clearly showed that the frequency of putative EBSs on the promoter is not correlated with expression levels of DEGs. For example, Frmd6 with more than 10 EBSs on its promoter had 1.5 fold changes and Ddit4l with only one EBS was the most down-regulated gene among DEGs.
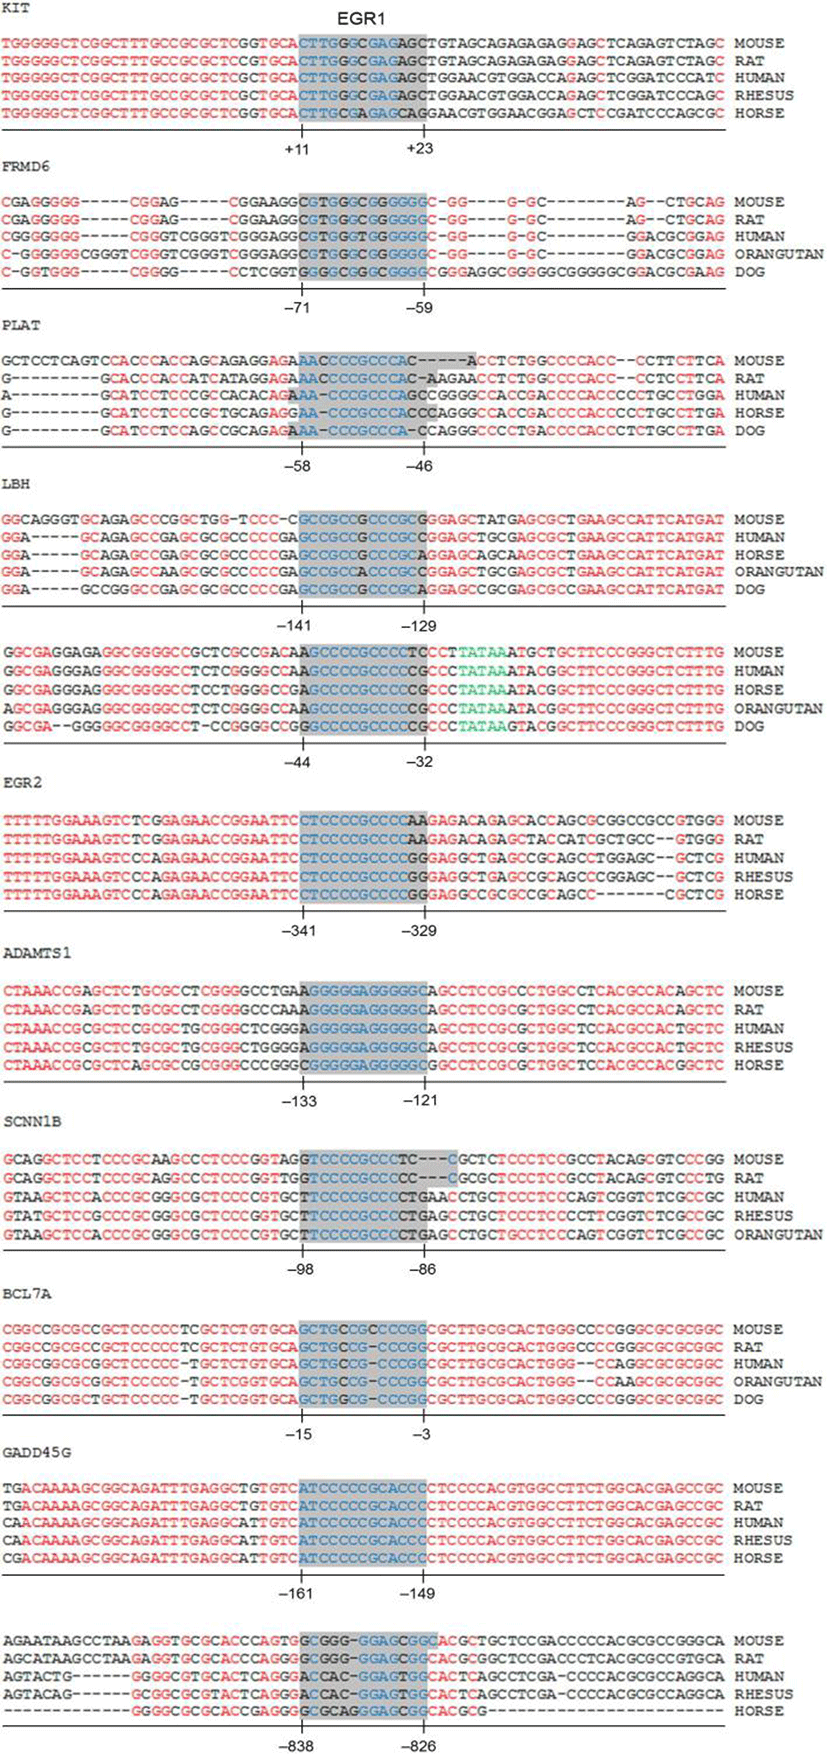
To efficiently identify biologically active EBS on the promoter of DEGs with bioinformatic tools, it has been examined whether the promoter sequences of DEGs were conserved between species. Promoter sequences of DEGs were collected from seven different species as much as their promoter sequences are available and analyzed by using Promo. In silico analyses with Promo provided that 11 EBS in 9 DEGs were highly conserved between species, among 276 EBS in the promoters of 102 DEGs (Fig. 4). Interestingly, 10 out of 11 highly conserved EBS were located within –0.5 kb of DEGs’ promoters.
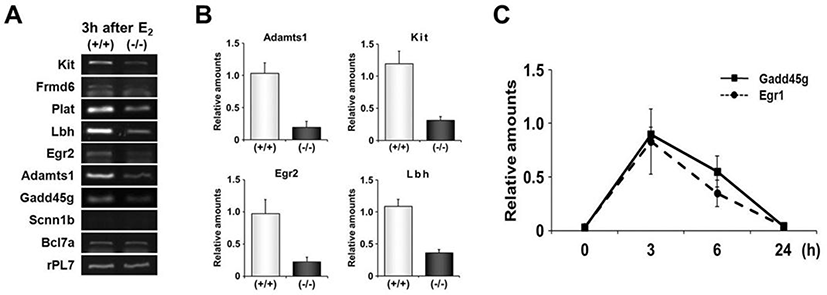
RT-PCR was performed to validate expression levels of DEGs with highly conserved EBS in their promoters. Among 9 genes whose promoters have been extensively investigated in this study, 7 genes were differentially expressed between uteri of OVX Egr1(+/+) and Egr1(–/–) mice (Fig. 5A). Real-time RT-PCR results showed that all 7 DEGs including Lbh, Egr2, Kit and Adamts-1 were significantly down-regulated in Egr1(–/–) uteri 3 h after estrogen treatment (Fig. 5B). A time-course expression profile of Gadd45g seems to be a replica of Egr1, suggesting that Gadd45g could be one of the target genes regulated by Egr1 at transcriptional levels in the uterus. Collectively, these 7 DEGs could be considered as putative EGR1 direct target genes whose transcription is in part regulated by EGR1 in the uterus. Further studies will be focused on these genes to dissect out physical interaction(s) of EGR1 with EBS in the promoters of these DEGs in the uterus.
DISCUSSION
Egr1 is an immediate early response gene which orchestrates a second wave of expression as transcription factor in various biological events (Milbrandt, 1987; Thiel and Cibelli, 2002). Estrogen induces Egr1 via ERK1/2 dependent activation of ELK-1 in MCF-7 breast cancer cells (Chen et al., 2004). In addition, we have clearly demonstrated that estrogen induces Egr1 via nuclear estrogen receptor-ERK1/2 pathway (Kim et al., submitted). To understand function(s) of EGR1 as transcriptional regulator in various biological conditions, identification of target genes directly regulated by EGR1 at transcriptional levels is critical. However, there is no known gene(s) which is directly regulated by EGR1 at the transcription level in the uterus. Thus, we have performed two independent in silico analyses for a collection of mRNA microarray data to identify potential target genes whose transcription is directly regulated by EGR1 in the uterus.
Many genes have been identified as direct target of EGR1 in various tissues and pathological conditions including cancers (Svaren et al., 2000; Virolle et al., 2003). Initial works to identify direct target genes of EGR1 had performed mRNA microarray in various cancer cells over-expressing EGR1 or normal cells after adenoviral infection for its overexpression. For example, several growth factors involved in tumor progression such as insulin-like growth factor-II, platelet-derived growth factor-A, and TGF-β1 were known to be direct targets of EGR1 (Svaren et al., 2000). In addition, EGR1 is responsible for overexpression of cyclin D2 in DU145 prostate cancer cells (Virolle et al., 2003). However, to identify direct target genes that are biologically active in physiological condition(s), analyses of mRNA microarrays performed in an experimental condition such as overexpression are not as optimal as those performed with in vivo condition(s). Thus, in silico analyses for a set of genes collected from expression profiles with a certain in vivo condition were performed to identify direct target genes of EGR1 in the uterus (Fig. 1). DEGs between uteri of Egr1(+/+) and Egr1(–/–) mice 3 h after estrogen treatment have potential to be transcriptionally regulated by EGR1 since Egr1 is rapidly and transiently induced within 2 h after estrogen treatment (Kim et al., submitted). As shown in Fig 2, DEGs have more number of putative EBS within -2 kb promoter sequences than in the promoter of randomly selected non-DEGs in general. A similar approach has been performed to identify EGR1 target genes in leiomyoma in a previous work (Ishikawa et al., 2007). They performed in silico analyses for finding putative EBS in the promoter of genes which are downregulated with Egr1 in leiomyoma, and demonstrated that 50 out of 135 listed genes possessed potential binding sites for EGR1 within 1 kb promoter sequence. In this study, different bioinformatic tools have been utilized to enhance efficiency to select EBS with higher probability for being biologically active in the uterus. MatInspector can be a useful method to provide most true positive transcription factor binding sites matches and reduce the amount of false positive matches in a promoter region, although not all sites found are necessarily functional in the particular biological context (Cartharius et al., 2005). By applying it, we were able to confirm that most of EBS are enriched within –500 bp promoter sequence. This result is consistent with a previous report that most EBS are enriched in –500 bp promoter region of EGR1 target genes in M12 prostate cancer cells (Arora et al., 2008). Promoters of MMP-9, P21, and GDNF have EGR1 consensus binding motifs within –500 bp (Choi et al., 2008; Shin et al., 2009). EGR1 consensus binding motifs were found within –500 bp of the LH-β subunit promoter in many species (Lee et al., 1996).
Furthermore, another bioinformatic tool, Promo, was applied to perform comparative analyses for sequence conservation between several species whose promoter sequences are available (Messeguer et al., 2002). Since critical sequences within the promoter such as transcription factor binding sites should be evolutionally conserved for transcription regulation, comparative analyses for sequence conservation between various species including human, mouse and rat, could improve efficiency to identify bio-logically active EBS in putative EGR1 target genes. Two-step in silico analyses with a collection of genes chosen from expression data provided 11 EBS within –500 bp promoter of 9 genes considered as Egr1 direct target with higher potential in the uterus (Figs. 2 and 4). Although SCNN1B is not expressed in the uterus and the expression pattern of BCL7A is not altered in Egr1(–/–) uteri, the other 7 genes with EBS in their promoters are significantly down-regulated in the uterus deficient of EGR1 (Fig. 5). Collectively, this study as well as previous works strongly suggests that these EBS, at least some, could physically interact with EGR1 in the uterus. Further studies such as chromatin immunoprecipitation (ChIP) and/or luciferase assays for EBS will be required to reinforce that these EBS are biologically active in the uterus. Recently, high-throughput screening technologies such as ChIP-sequencing or ChIP with promoter array (ChIP-chip) have been performed to identify unknown direct target genes in vitro and in vivo (Tang et al., 2010; Koldamova et al., 2013). However, it is difficult to examine whether ChIP assay, a technically demanding experiment, is properly performed unless there is any known target(s) in the context of interest. Thus, experimental approaches performed in this study are useful to identify unknown target genes. In conclusion, two-step in silico analyses with expression profiles from mRNA microarray could provide a list of putative direct target genes of EGR1 in the uterus which does not have any known targets for further screenings such as ChIP-sequencing and ChIP-chip.
